Power BI reporting for a CHF 1bn+ construction project
dy Project AG steers demanding construction and infrastructure projects. For a major project worth over CHF 1 billion, smiit built a central Power BI reporting landscape — data from SQL Servers, Excel and cloud systems, consolidated through Azure Databricks. Over more than two years, this created a consistent picture for management and project control.
Published
CHF 1bn+
project volume steered through the reporting landscape
- Industry
- Construction & infrastructure
- Region
- Switzerland
- Service
- Data platform & Power BI reporting
- Platform
- Azure Databricks + Power BI
- Timeline
- 2+ years (ongoing)
Starting point: many data sources, many stakeholders, no single picture
Large construction projects generate enormous amounts of data: progress, budget, timelines, delays, risks, meetings, actions and status rarely sit in a single system — they are spread across platforms, files and domain applications.
Here too, the relevant data came from very different system types — SQL Server databases, manually maintained Excel files, cloud systems and domain applications that had to be connected via REST interfaces. Some delivered structured data, others only partly standardized exports. Manageable for individual teams; at management level it became a problem: information had to be gathered, compared and interpreted from many sources, making a consistent, up-to-date overall picture hard to achieve.
Technically that meant: wiring individual Power BI reports straight to the sources isn't enough given this data volume, system diversity and number of users. First you need a solid data platform with clear data flows, defined models, role management and governance — and only then reporting that is performant, traceable and maintainable in the long run.
Solution: Azure Databricks as a central data platform ahead of Power BI
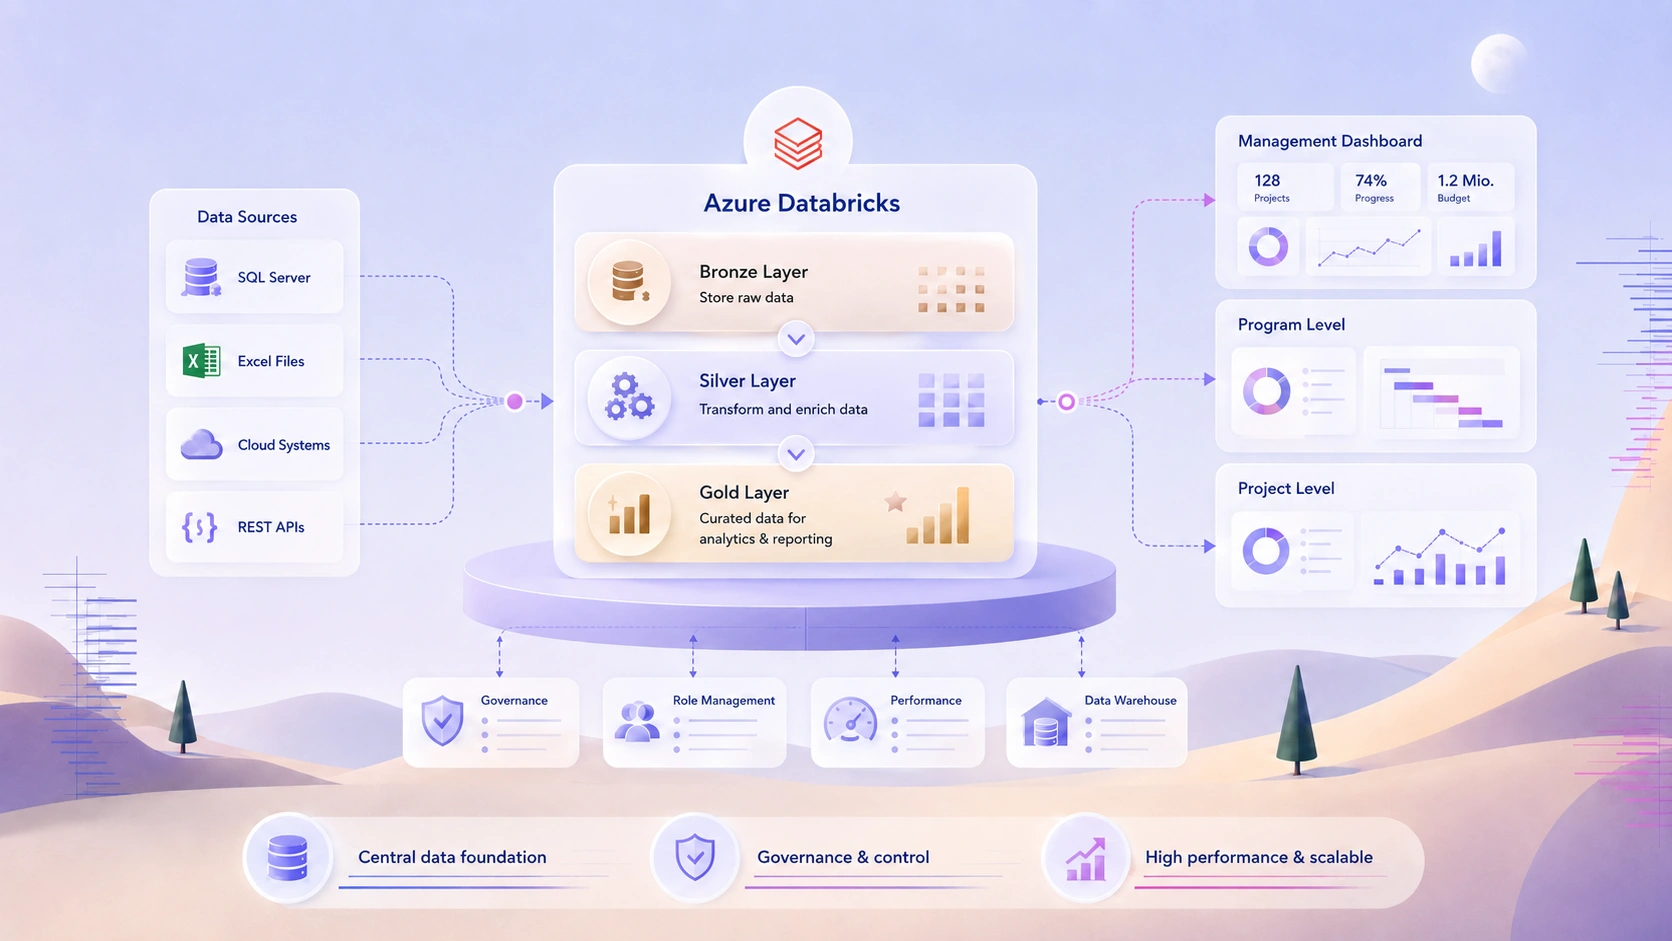
smiit built a central data architecture in which data from the source systems is first consolidated in Azure Databricks — deliberately an upstream data-warehouse approach rather than complex transformation logic directly in Power BI. This keeps Power BI as the analytical surface for management and project control, while integration, harmonization and quality logic happen in a scalable platform: more stable, faster and more maintainable reports.
The data passes through a multi-layer bronze/silver/gold architecture. In the bronze layer, raw data is ingested as unchanged as possible — providing traceability back to the source. In the silver layer it is cleaned and harmonized: consistent project and program structures, consistent date logic, cleaned status values, and merged risk and schedule structures.
In the gold layer, curated data models optimized for analysis are created: management metrics, project status, budget development, schedule variances and risk categories are prepared so Power BI can evaluate them performantly and understandably. Data is no longer visualized ad hoc but systematically turned into a solid reporting foundation that grows with new requirements.
Data integration: SQL Server, Excel, cloud systems and REST APIs
A core part of the work was integrating very different sources. Structured data from SQL Servers was connected directly; in addition, smiit processed Excel files, which still play an important role in project organizations — for status lists and manual additions, for example. Cloud systems and domain applications were connected via REST APIs; where data wasn't available in the required form, smiit built and structured the interfaces.
This work is decisive, because Power BI is only as good as the data beneath it: a dashboard built on inconsistent, manually copied data quickly breeds mistrust at management level. The upstream platform makes data flows more transparent and definitions more consistent — less manual consolidation, less room for interpretation, and a more reliable basis for project decisions.
Power BI: management dashboards instead of isolated reports
Several Power BI reports were built on the curated gold data models — primarily for management, but also supporting program and project leads. They cover progress, budget, schedules, delays, meetings, actions and risks, and relate them to one another: it becomes visible, for instance, which delays connect to critical risks or which budget developments trace back to which project areas.
The reporting structure is hierarchical — from the management view through program and project levels down to detailed analyses — so the same landscape serves strategic steering sessions and operational detail questions. A key focus was performance: data modeling, measures, filter logic and report navigation were designed so the reports respond quickly and stay understandable with large data volumes, multiple hierarchy levels and many users.
Role management, governance and operations in the Power BI Service
Because different user groups use the reports, governance was central — not everyone needs the same view of data and detail. A role-based structure organizes access along responsibilities: clear workspace structures, agreed permissions, controlled publishing and, depending on context, row-level security, app distribution or separate development, test and production areas.
This keeps reporting from becoming an uncontrolled collection of individual files and turns it into a managed BI landscape where it's clear which reports are in production, which data models are used and which groups have access. At this scale that's decisive: management reporting has to be not only correct but organizationally robust.
Trade-off: quickly visible reports and a durable data architecture
The central tension was between quickly visible results and a clean data architecture: a purely report-driven approach quickly leads to hard-to-maintain Power BI files, duplicated logic and inconsistent metrics. smiit resolved it iteratively — first MVP reports to make requirements visible and discussable with stakeholders, while professionalizing the Databricks architecture in parallel. Management and business units worked with concrete visualizations early, while the technical foundation grew steadily more stable — fast progress without a long-term dead end.
What we learned: metric definitions beat beautiful dashboards
The iterative MVP approach sped up collaboration — but it had a cost we underestimated. As soon as the first attractive dashboards were in place, stakeholders argued not about the visualization but about the numbers themselves: what exactly counts as a 'delay', when is a work package 'behind schedule', how is a 'status' defined across different source systems? The same metric meant different things to different teams and systems.
So the apparent debate about whether the report was correct was really a debate about missing shared definitions — a data and semantics problem, not a tool problem. We learned to lock the business definitions down earlier: an agreed metric glossary as binding logic in the gold layer, before and while the dashboards are built. Only that single source of truth ended the recurring definition debates in the status meetings.
- With distributed data sources, the bottleneck is the business definition of a metric — not the visualization.
- A dashboard's credibility is decided by the consistency of its definitions, not the quality of its charts.
- Metric semantics belong in the gold layer as binding logic (a glossary as single source of truth) — otherwise management mistrusts even technically correct reports.
Result: a consolidated picture for management and project control
Over more than two years, a Power BI reporting landscape emerged that processes data from SQL databases, Excel files, cloud systems and manual status formats centrally and makes it available at management, program and project level — instead of merging it case by case. The result is a more current, more consistent and more traceable picture of the overall project.
For a construction project worth over CHF 1 billion, this overview is a substantial benefit: progress, budget, schedules, delays, meetings and risks can be analyzed across hierarchy levels, critical developments surface earlier and status meetings become more data-driven. Technically, the architecture ties together data integration, data-warehouse logic, Power BI reporting, governance and operations — and on the business side it creates the transparency needed to steer complex infrastructure projects.
Key figures at a glance
CHF 1bn+
project volume in the construction project
2+ years
building, operating and extending the reporting landscape
4+
source types: SQL Server, Excel, cloud, REST APIs
Dozens
workshops with stakeholders and business units
Technology & architecture
- Power BICentral reporting & management surface
- Power BI ServicePublishing, permissions & report operations
- Azure DatabricksCentral data processing & transformation
- Bronze/Silver/Gold layersTraceable, scalable data processing
- SQL ServerSource for structured project data
- Excel filesIntegration of manual & domain project data
- REST APIsConnecting cloud systems & domain applications
- Data warehouse / lakehouse architectureScalability, traceability & performance
- Role management & governanceControlled use across different stakeholders
Key terms from our glossary
View the glossaryThe core terms around this topic – explained clearly and grounded in practice.
smiit helped us turn a complex, distributed data landscape into structured management reporting. What stood out was the combination of technical data integration, an understanding of project control, and the ability to translate many stakeholders' requirements into clear Power BI reports.