Most software products aren't born from an idea on the drawing board. They emerge from a pattern you eventually can't ignore any more. For us, it was a cluster of requests from a direction we hadn't expected: Swiss SMEs that finally wanted to analyse their bexio data properly.
This article tells how those requests first turned into a Power BI-based product, why that product hit its commercial limits, and how we then rebuilt smiit Analytics as a SaaS platform of its own. It is about architecture decisions, about bugs you only find with real accounting data, and about what AI-assisted software development actually delivers on a demanding project — and what it doesn't.
Why bexio, of all things?
At its core, smiit is a service provider for apps, workflows and analytics for mid-sized companies. For a long time our focus was order management and custom business applications. Software used exclusively in Switzerland was not on our radar.
Between late 2021 and late 2025 we then received five or six requests that related specifically to bexio. That doesn't sound like much. For a single third-party system — one outside our home market, no less — it was remarkably many. The requests were strikingly similar: the data lives in bexio, day-to-day business runs well there, but for analysis over time, across departments or for steering the company, the built-in tools fall short.
In hindsight the pattern is easy to explain. bexio is widespread in Switzerland and reported more than 100,000 SME customers in February 2026. These companies keep accounting, orders, invoices, projects and time tracking in one system. The data for good financial controlling is already there — it just rarely gets used. Once you've recognised that, every further request stops looking like a one-off project and starts looking like a market.[1]
The first answer: smiit Analytics on Power BI
The obvious reaction was to do what we were already good at: Power BI. In 2024 we turned our previous projects into a standardised product. It consisted of a complete data model for bexio data and a large number of ready-made reports. At the end of 2025 it went live on the bexio Marketplace.
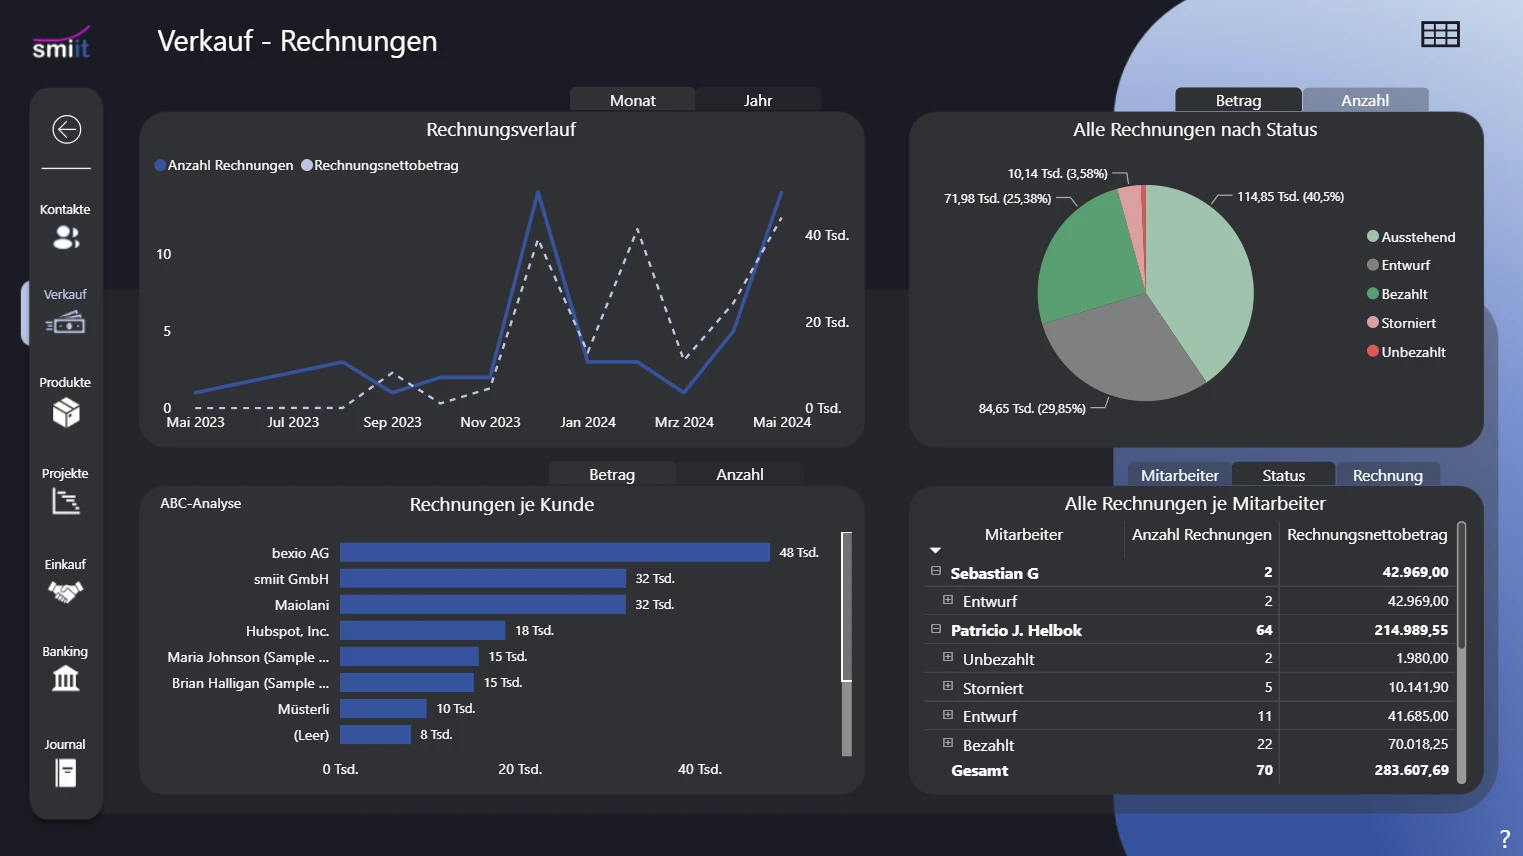
The product had real strengths:
- Maximum flexibility. Power BI is a mature tool. Almost any analysis could be built.
- Data stays with the customer. The solution was set up and operated in the customer's own environment.
- Fast time to value. The ready-made reports covered most standard needs out of the box.
The weaknesses didn't show up in the technology, but in the business model.
Why the one-off price became a trap
Because the solution was set up once at the customer's site and hosted there, we had no control over access or usage. A usage- or user-based subscription was practically impossible. What remained was a one-off price.
On top of that, almost every customer wanted customisations. And every customisation was development work we had to bill by effort. The requests fell into two clearly distinct groups:
- Operationally run companies mainly wanted HR analytics: timesheets, utilisation and planned-versus-actual hours, often combined with automation such as regular emails to employees.
- Fiduciaries and finance leads were interested in the financial data. They wanted the balance sheet, income statement and KPIs structured exactly the way they need them for their clients.
For many customers, especially smaller ones, the one-off price plus customisation effort added up to an amount that didn't fit their budget. We had a good product with a pricing model that excluded its own target group.
The lesson behind it
In retrospect, we were caught in a tension that is well described in the literature. Cusumano shows how the software business is shifting from selling product licences towards services and recurring revenue, and what that means for margins and business models. Pine describes, under the term mass customisation, the challenge of delivering individual offerings at the cost of a standard product.[2][3]
Our Power BI product was positioned wrongly on both counts. It was a product with project logic: standardised at the core, but every customisation cost just as much as in the project business. The conclusion was clear. We needed a product in which customisation no longer meant development effort on our side.
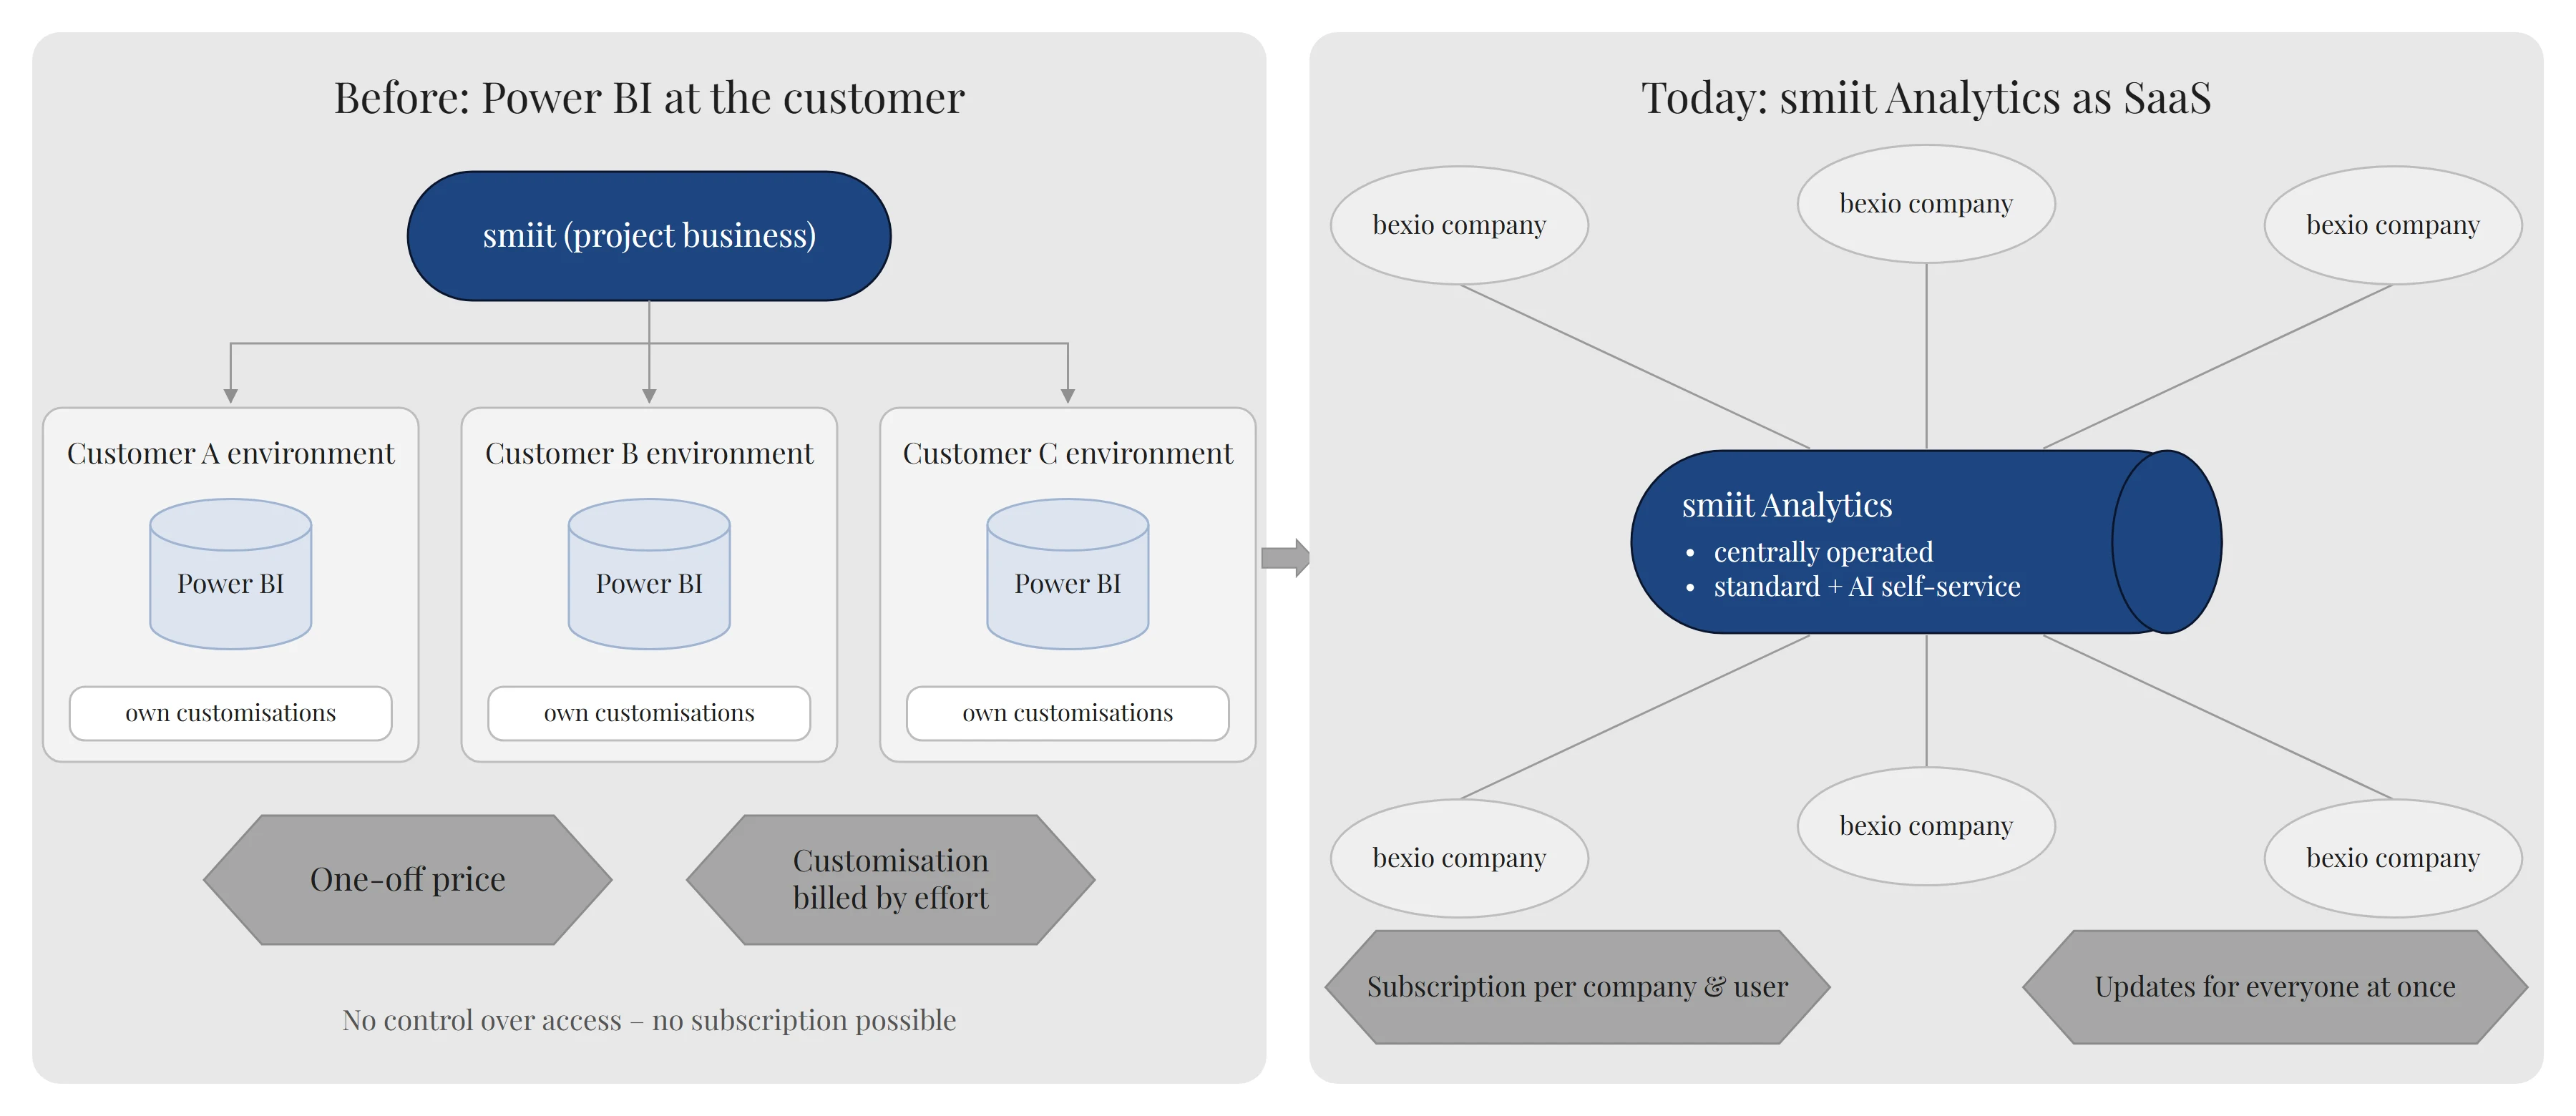
The reset: what the new product had to deliver
Before writing a single line of code, we redefined the requirements. The most important ones were:
- 1Real SaaS instead of an installationA centrally operated application in which many customers work securely separated from one another. Only this makes updates, support and a subscription model possible at all.
- 2A fair, predictable pricing modelA subscription per connected bexio company and per user, sold through the bexio Marketplace, instead of a high one-off price.
- 3Customisation without development effortThe customisation requests from the Power BI days should either be part of the standard or be something customers can implement themselves.
- 4No setup at the customer's siteSign up, connect bexio, done. Data should stay up to date automatically, without manual exports.
- 5Data protection as a baselineWe're dealing with accounting and HR data. Tenant isolation, encryption and auditable access are non-negotiable.
Requirement 3 led to the most important product decision: we combine a strong standard with AI assistance. The typical requests from the Power BI days — hours, utilisation, balance sheet, income statement and KPIs — are built directly into the standard report. For everything beyond that, customers can create and adapt their own reports, optionally with the help of an AI that answers questions about the data and edits reports. That way even very individual requirements fit into a standard product.
Why not simply Power BI Embedded?
The question was obvious, and we took it seriously. Power BI Embedded is strong for classic reporting. For our goal, however, it would have tied us to a licensing and embedding model we don't control — bringing back exactly the cost structure we wanted to escape. We also rejected embedding an open-source BI tool such as Metabase or Superset: for users it quickly feels like a foreign body, and it leaves little room for an AI that is deeply integrated into the data model and reports.
So we decided to build our own application, based on proven open-source building blocks.
The architecture at a glance
The data flow can be described in five stages:
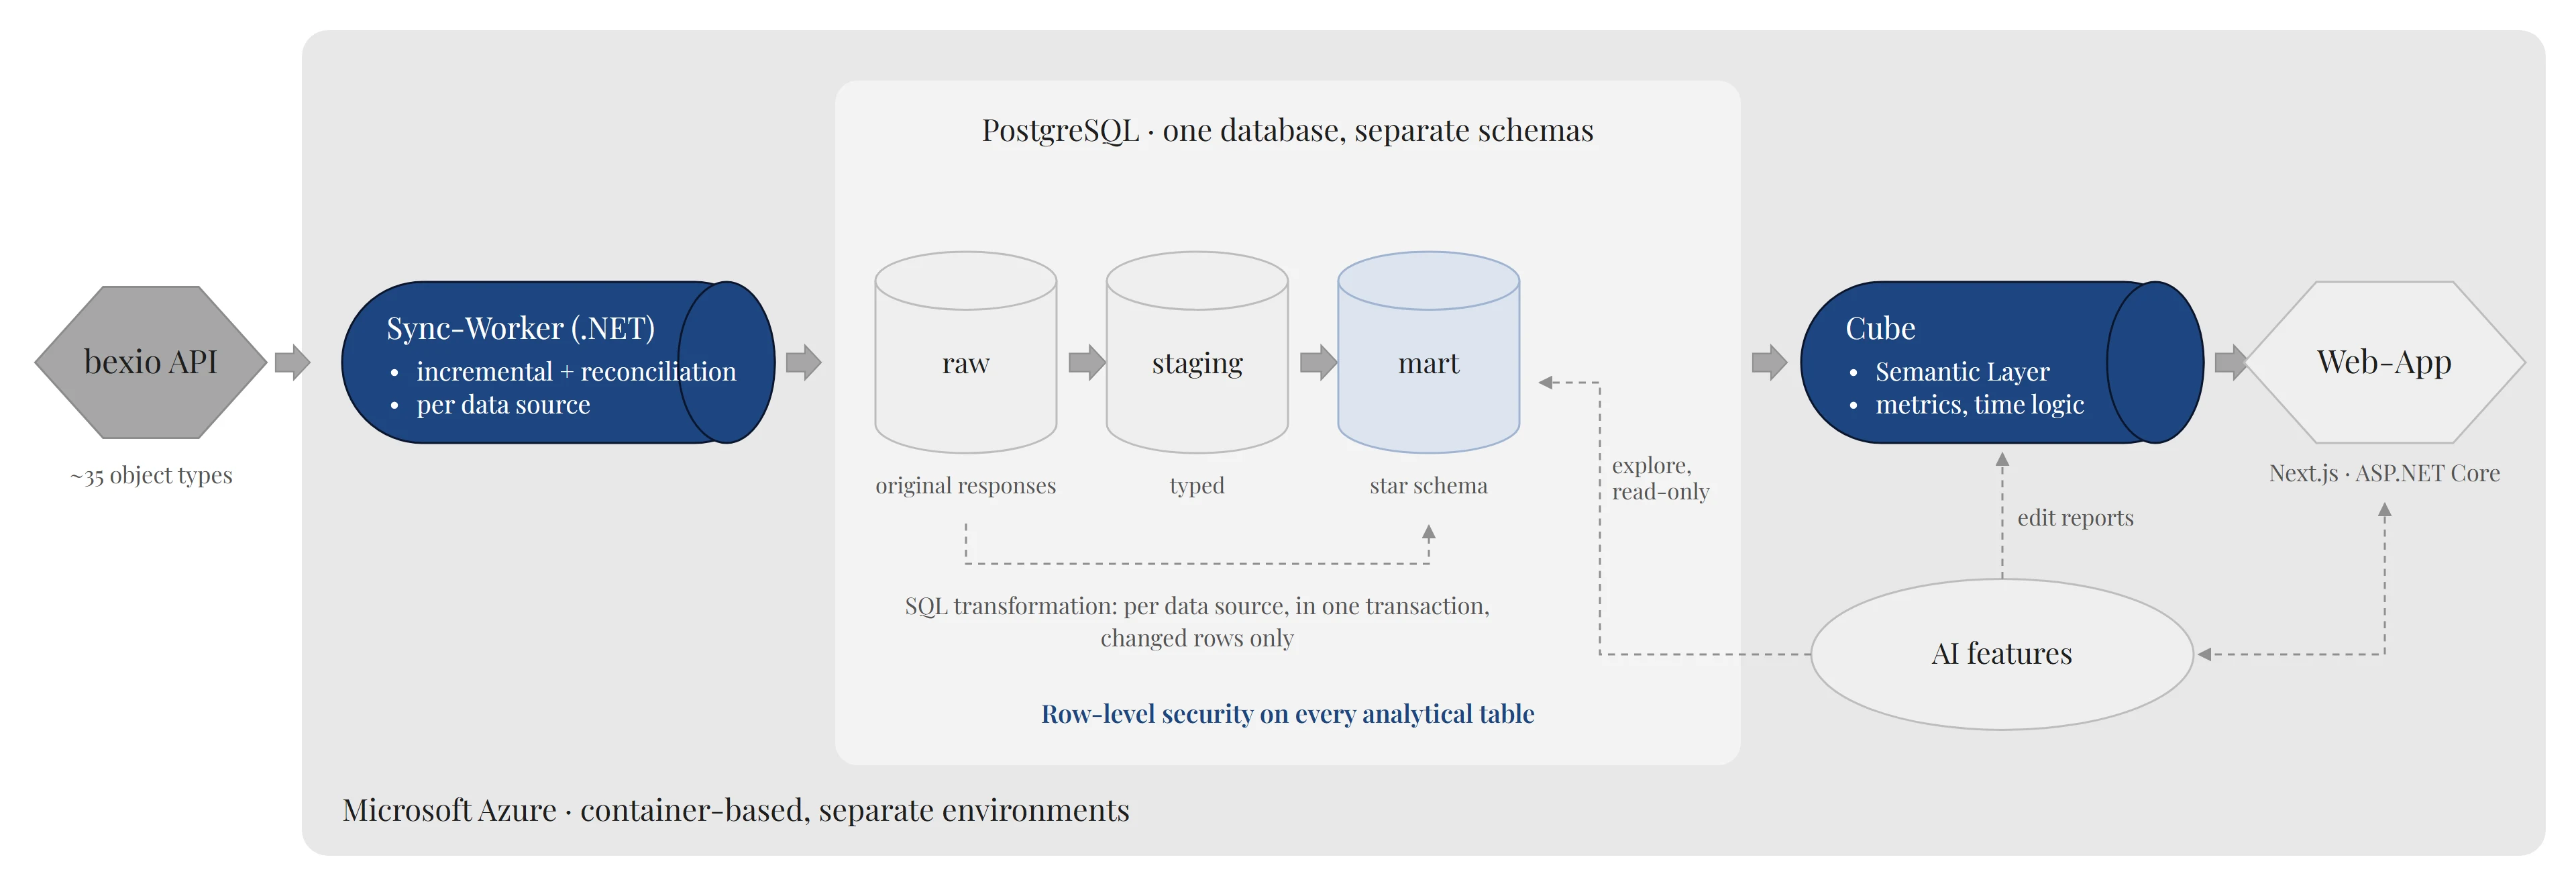
| Layer | Technology | Purpose |
|---|---|---|
| Data integration | .NET Worker Service | Loads around 35 object types from bexio: accounting, orders, invoices, banking, projects, time entries, HR |
| Raw data & staging | PostgreSQL (raw, staging) | Stores the original responses unchanged and converts them into typed tables |
| Analytical model | PostgreSQL (mart) | Star schema with facts and dimensions, prepared for analysis |
| Semantic layer | Cube | Defines metrics, relationships and time logic centrally — one query language for reports and AI |
| Application | Next.js/React, ASP.NET Core API | Reports, filters, editing, user management, AI features |
| Operations | Microsoft Azure | Container-based, automated deployments across separate environments |
The analytical model follows Kimball and Ross's dimensional modelling: facts such as journal lines, invoice items or time entries are connected through shared dimensions such as date, customer, account or project. That way revenue, open items and hours can be filtered together in one report without every combination having to be programmed individually.[4]
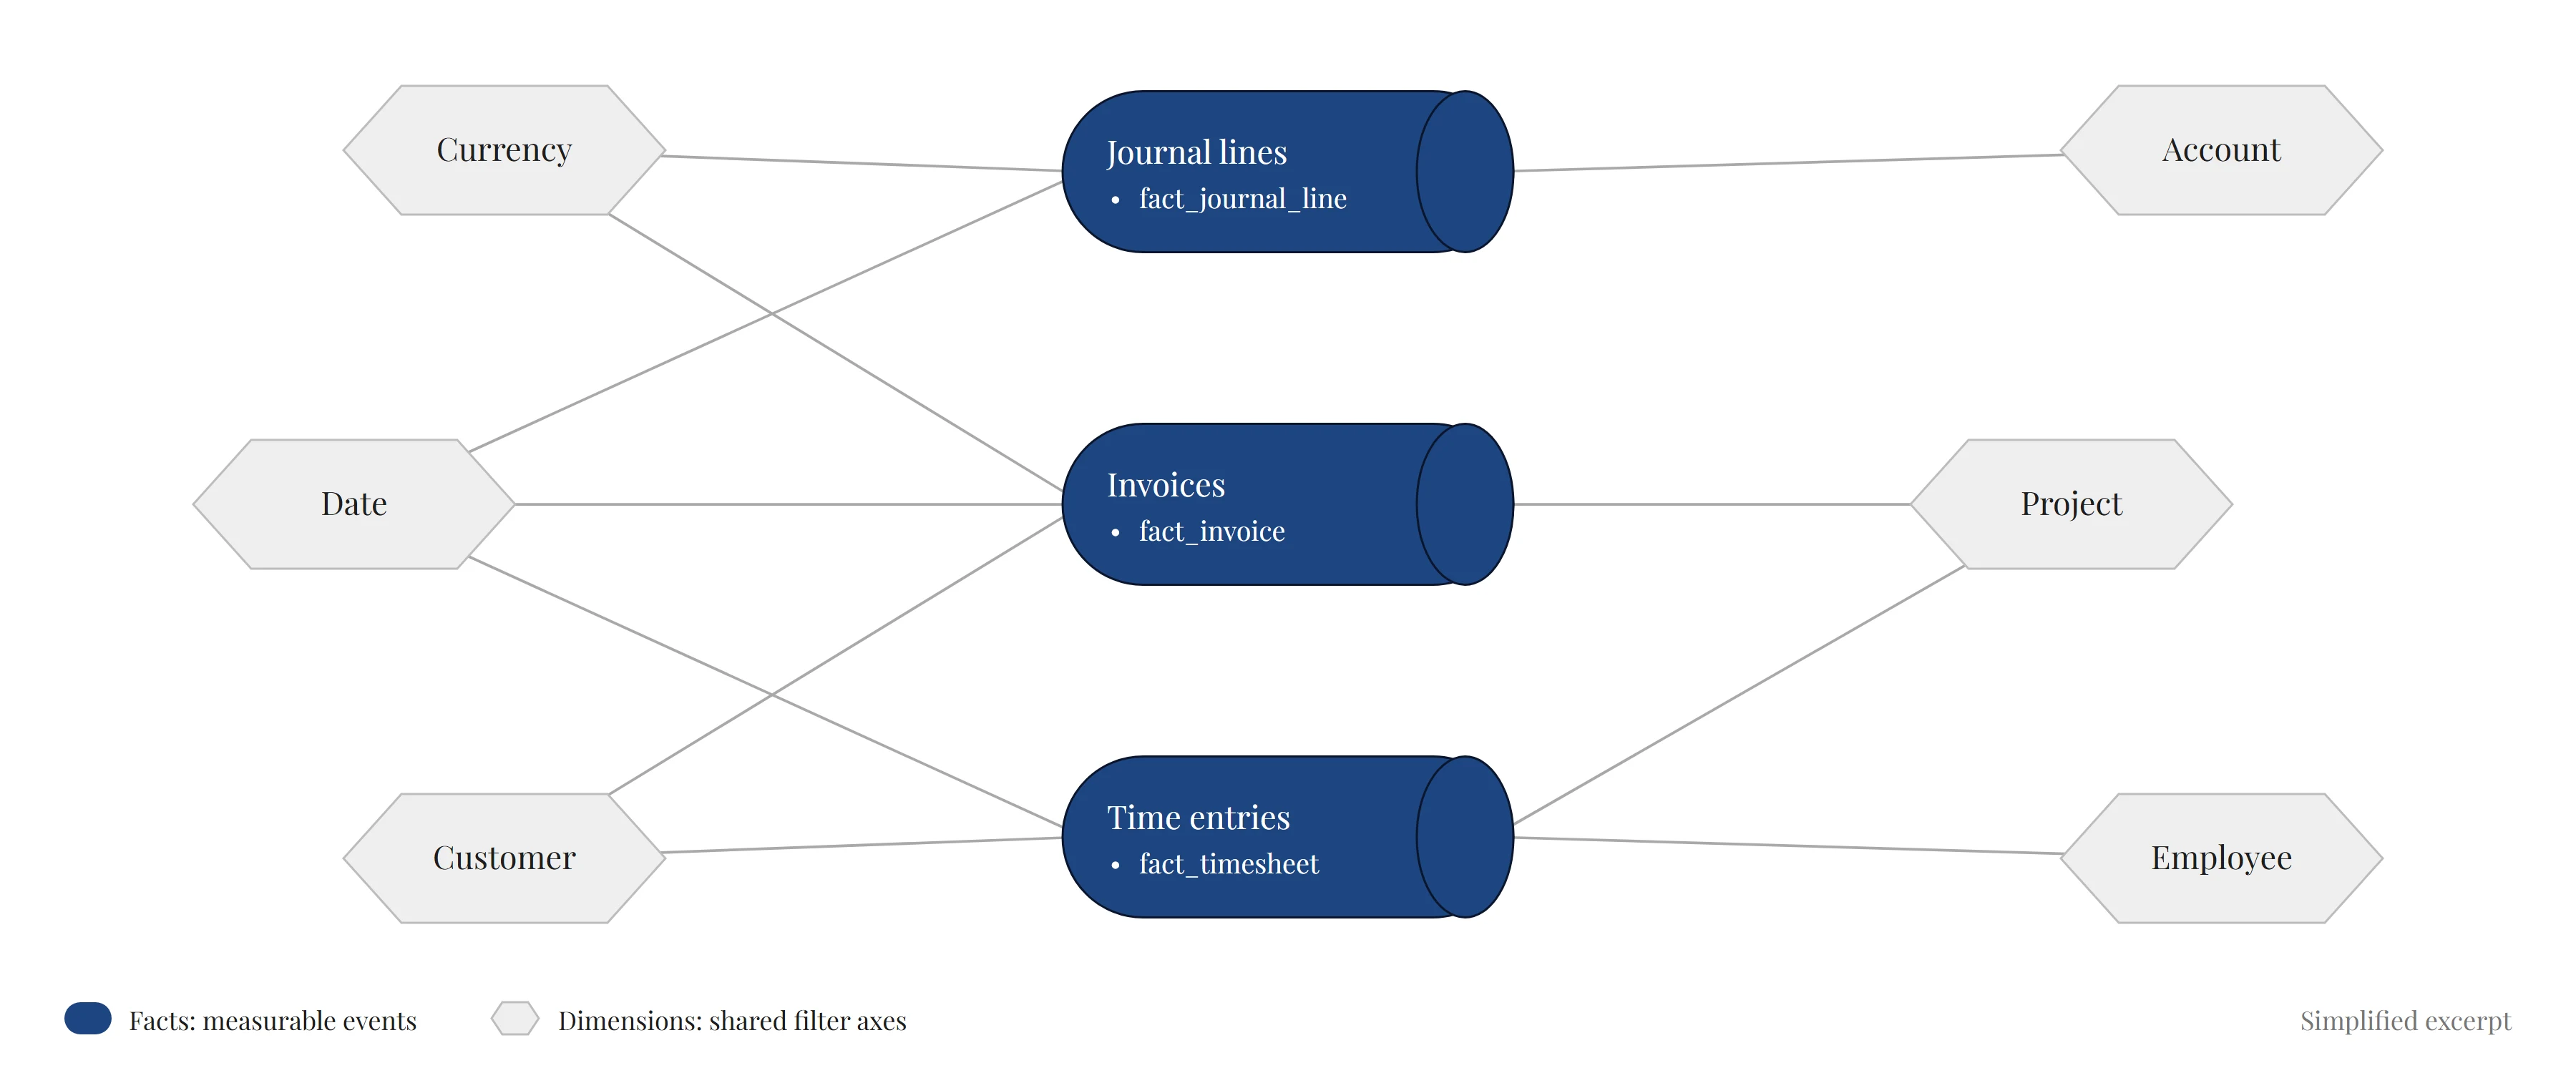
In smiit Analytics, reports are not hard-coded pages but declarative definitions: which visualisation shows which metric by which dimension. That has a far-reaching advantage. Whatever is described as data can be validated, versioned and compared — and it can be edited by an AI without any code being generated.
The biggest challenges and how we solved them
1. Tenant isolation that holds even when things go wrong
In a SaaS application, many customers share the same infrastructure. Economically, that is the core of the model — and at the same time its biggest risk. Bezemer and Zaidman point out that a wrong architecture decision on multi-tenancy quickly turns into a maintenance problem. The Force.com architecture shows how far a consistently shared model can go when isolation is anchored in the foundation. Microsoft's architecture guidance describes the range from fully isolated to fully shared models and the trade-offs of each.[5][6][7]
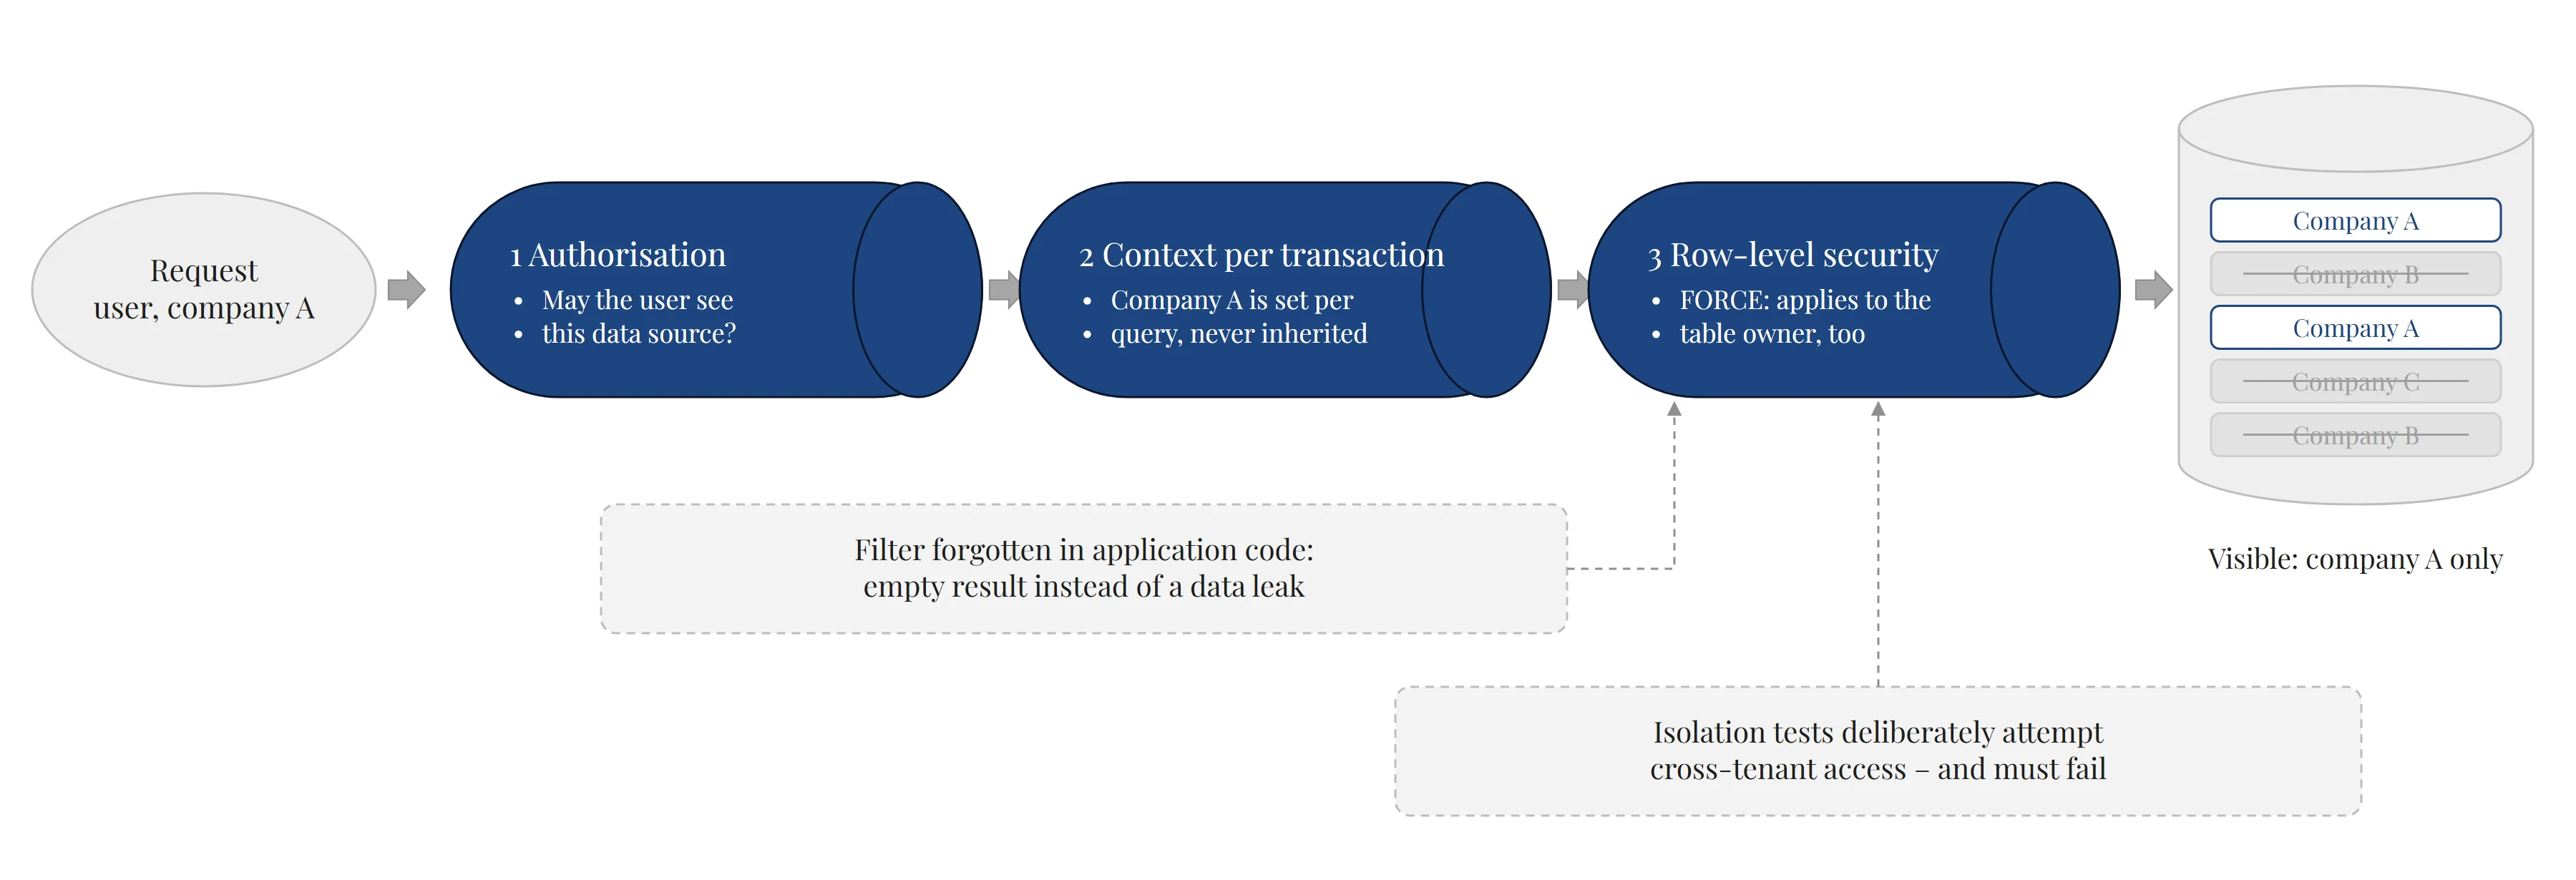
We opted for a shared model with several lines of defence:
- The database is the last line of defence. Every analytical table is protected by PostgreSQL row-level security. These policies also apply to the table owner (
FORCE ROW LEVEL SECURITY). A filter forgotten in application code therefore doesn't cause a data leak — it produces an empty result.[8] - The context travels with every query. The application sets which bexio company is being queried per transaction. That way no context can “leak” from one request into the next on shared database connections.
- The boundary is the data source. What gets isolated is not the individual report but the connected bexio company. We corrected this decision early on. It allows several reports and users to access the same data source without weakening the isolation.
- Tests prove the isolation. Automated tests deliberately try to access other tenants' data — and must fail.
The same principle applies to platform operations. Even smiit administrators cannot see customer data unless the customer grants time-limited, logged support access.
2. The bexio integration: robust rather than quick
“Connecting” an API is done quickly. Connecting it so that many customers' data is reliably synchronised several times a day is a different job. A few things that kept us busy:
- Incremental where possible. Where the API allows it, we only load changed records, with an overlap window as a safety net. Where it doesn't, we load everything and discard unchanged records via a hash comparison.
- Detecting deleted data. Incremental queries don't return deletions. So we run a full reconciliation at regular intervals, ensuring deleted documents don't linger in the reports.
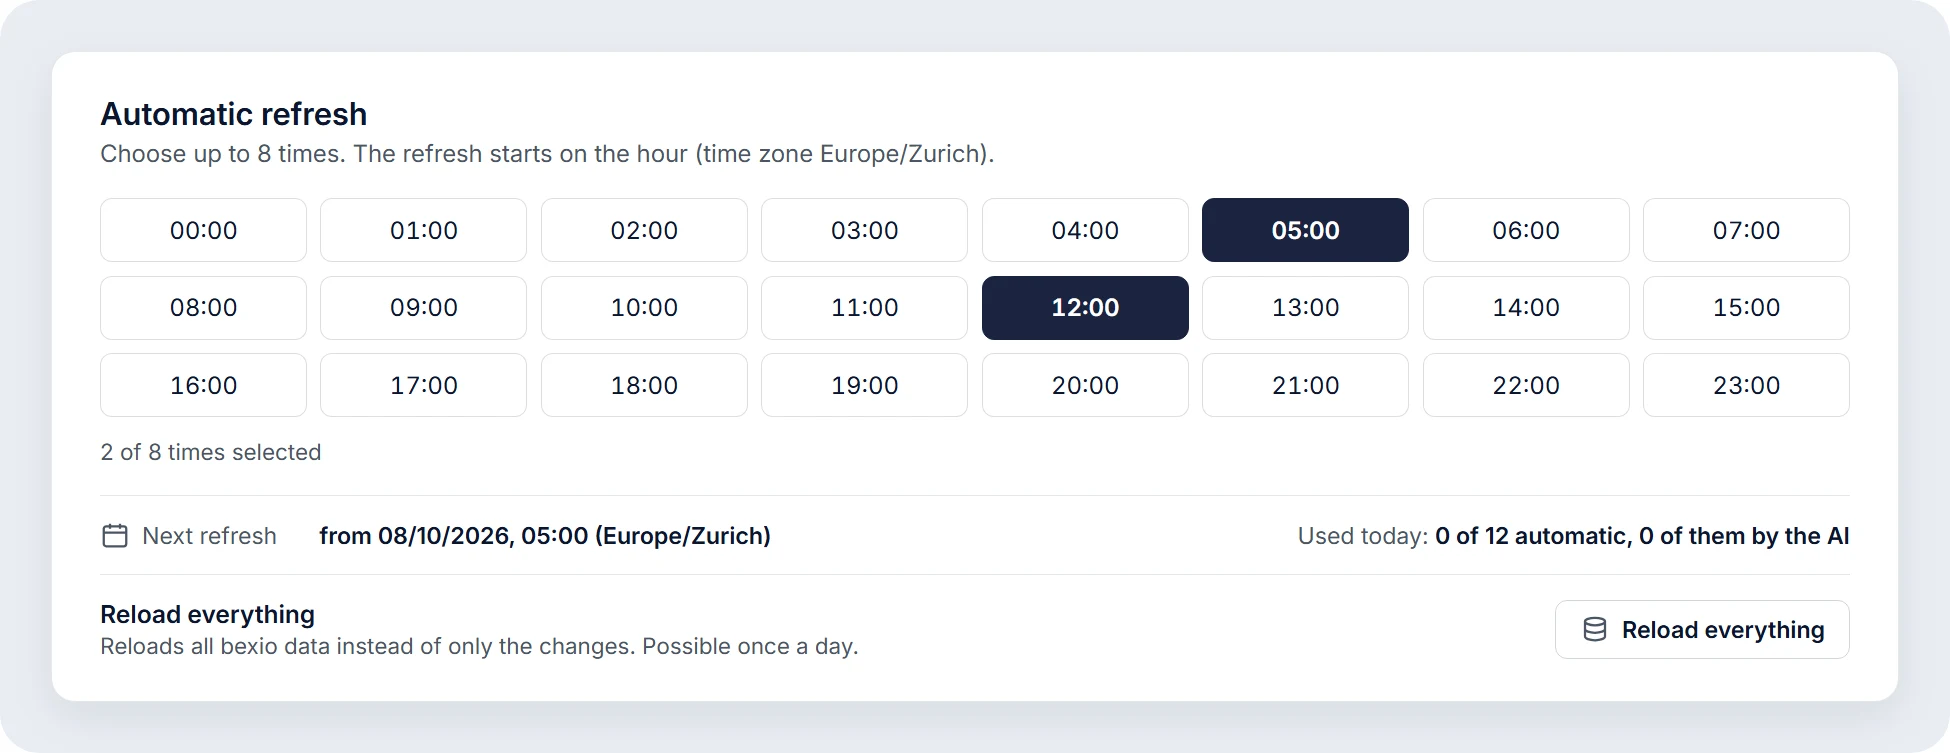
- Fair load distribution. API limits apply per connected company. We cap parallelism per connection and overall, respect the retry delays the API specifies, and spread automatic refreshes with a random offset so that not every customer syncs on the hour.
- Time isn't just time. Timestamps arrive without a time zone, in Swiss local time. Interpret them as UTC and you shift data by one or two hours — plus twice a year because of daylight saving time.
From the customer's perspective, all of this boils down to simple settings: every data source is refreshed automatically at times of their choosing, and a manual refresh is possible at any time. A daily refresh budget keeps the load — and therefore operating costs — predictable. That, too, is a prerequisite for a fair subscription price.
3. A deliberate departure from the standard stack
For transforming raw data into the analytical model, dbt is today's de facto standard. We started with it — and dropped it again after just one week.
The reason was a core requirement: a synchronisation has to work end to end. When a customer clicks “Refresh”, it shouldn't just reload the raw data. Exactly that customer's data should be computed all the way through to the report — immediately. dbt is designed as a batch tool that rebuilds entire models. It would also have added a second runtime and a second permission model alongside row-level security.
- 1Customer clicks “Refresh”
- 2Sync worker loads changed data from bexio (raw)
- 3Typing in staging
- 4SQL steps build the star schema (mart)
- 5All per data source in one transaction
- 6The report shows the new figures immediately
We therefore built the transformation into the .NET worker as an ordered sequence of SQL steps. It runs per data source in a single transaction, writes only rows that actually changed and skips itself if nothing has changed. That was more in-house development than we would have liked. But it's the point where the architecture follows the product, not the other way round.
4. Numbers that look plausible and are still wrong
This was the most instructive category of problems. A crash is noticed immediately. A balance sheet total that's three times too high may only be noticed by the fiduciary. A few examples we only found with real data:
- Opening balances per fiscal year. bexio books the opening balances anew in every fiscal year. A balance sheet query that isn't restricted to one fiscal year sums these balances across all years and inflates the result accordingly. Our solution is deliberately strict: the semantic layer rejects such queries before they reach the database.
- Top-N lists with empty entries. PostgreSQL sorts missing values first in descending order. As a result, a “top 10 customers by revenue” list showed customers without any revenue at the very top in certain combinations.
- Year-over-year comparisons with 0% growth. If a prior-year comparison is grouped by the year dimension rather than a real time axis, it compares every year with itself. The result is mathematically correct and useless from a business perspective.
- Foreign currencies. Every amount is held in its original currency and in the booking currency, converted at the rate valid on the document date — not today's rate.
The common pattern: accounting rules belong in one central place, and wherever they could be violated, the system should rather refuse than guess. This mindset also shapes how we handle AI.
5. Individual requirements in a standard product — with AI
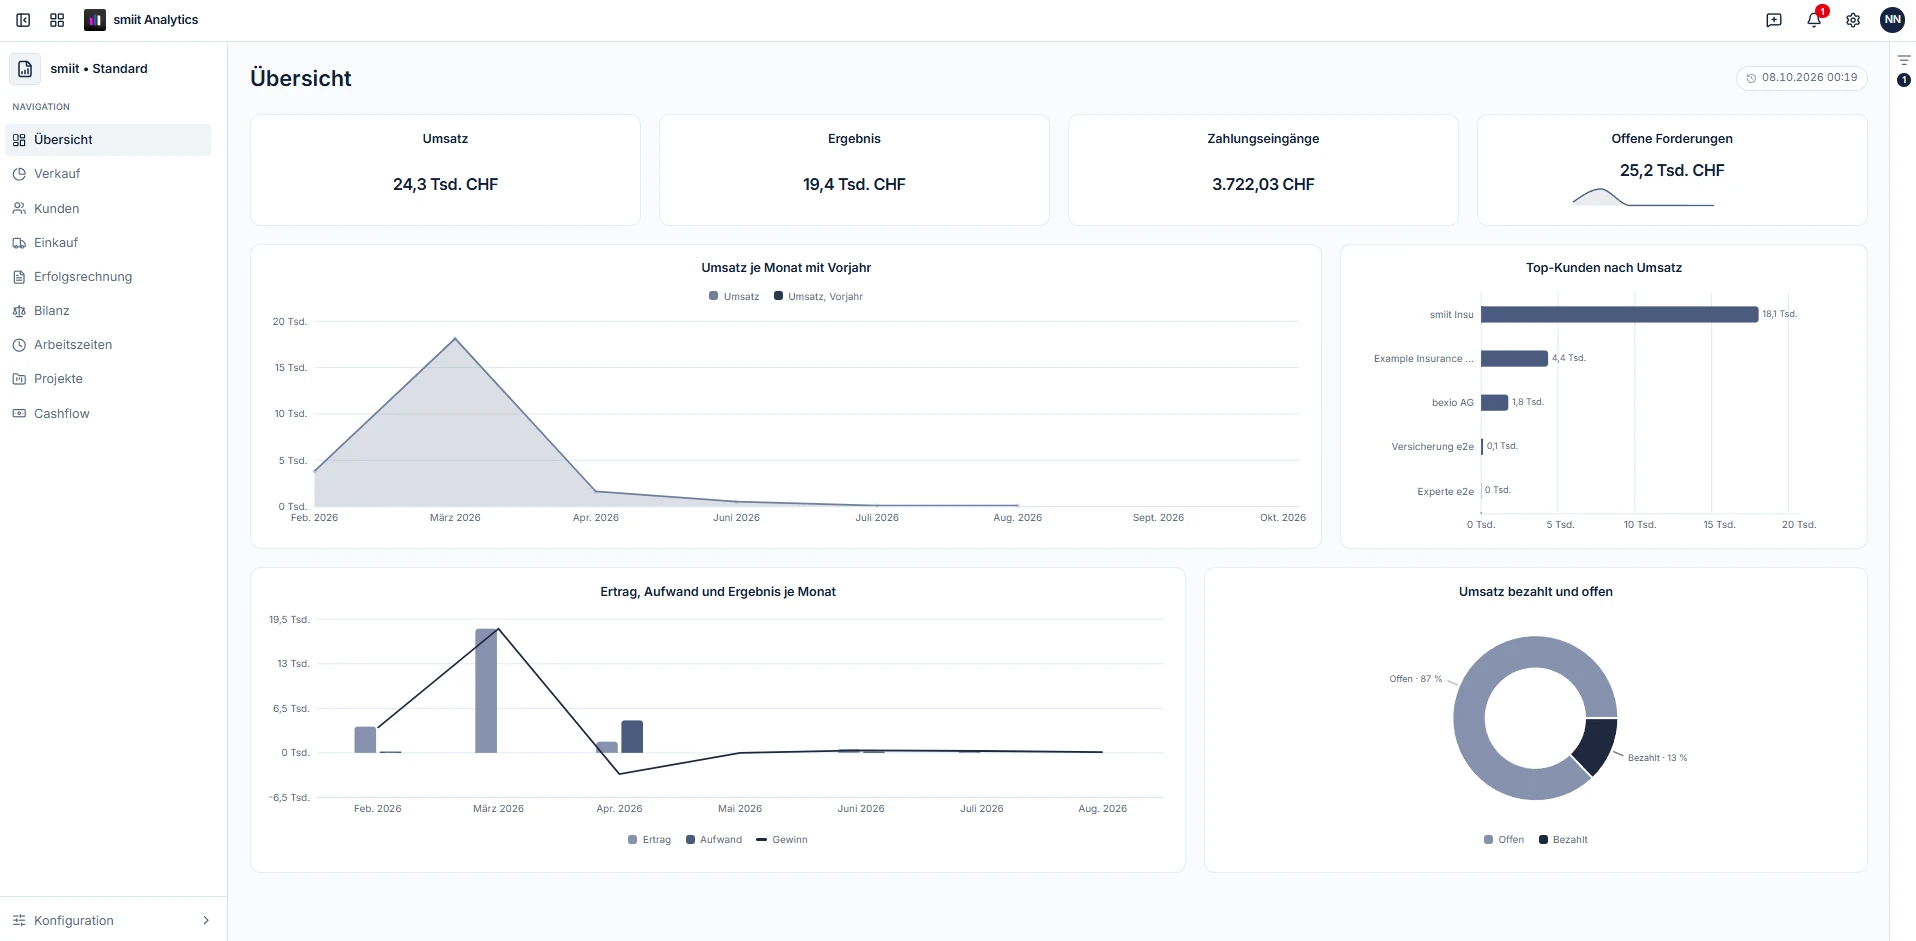
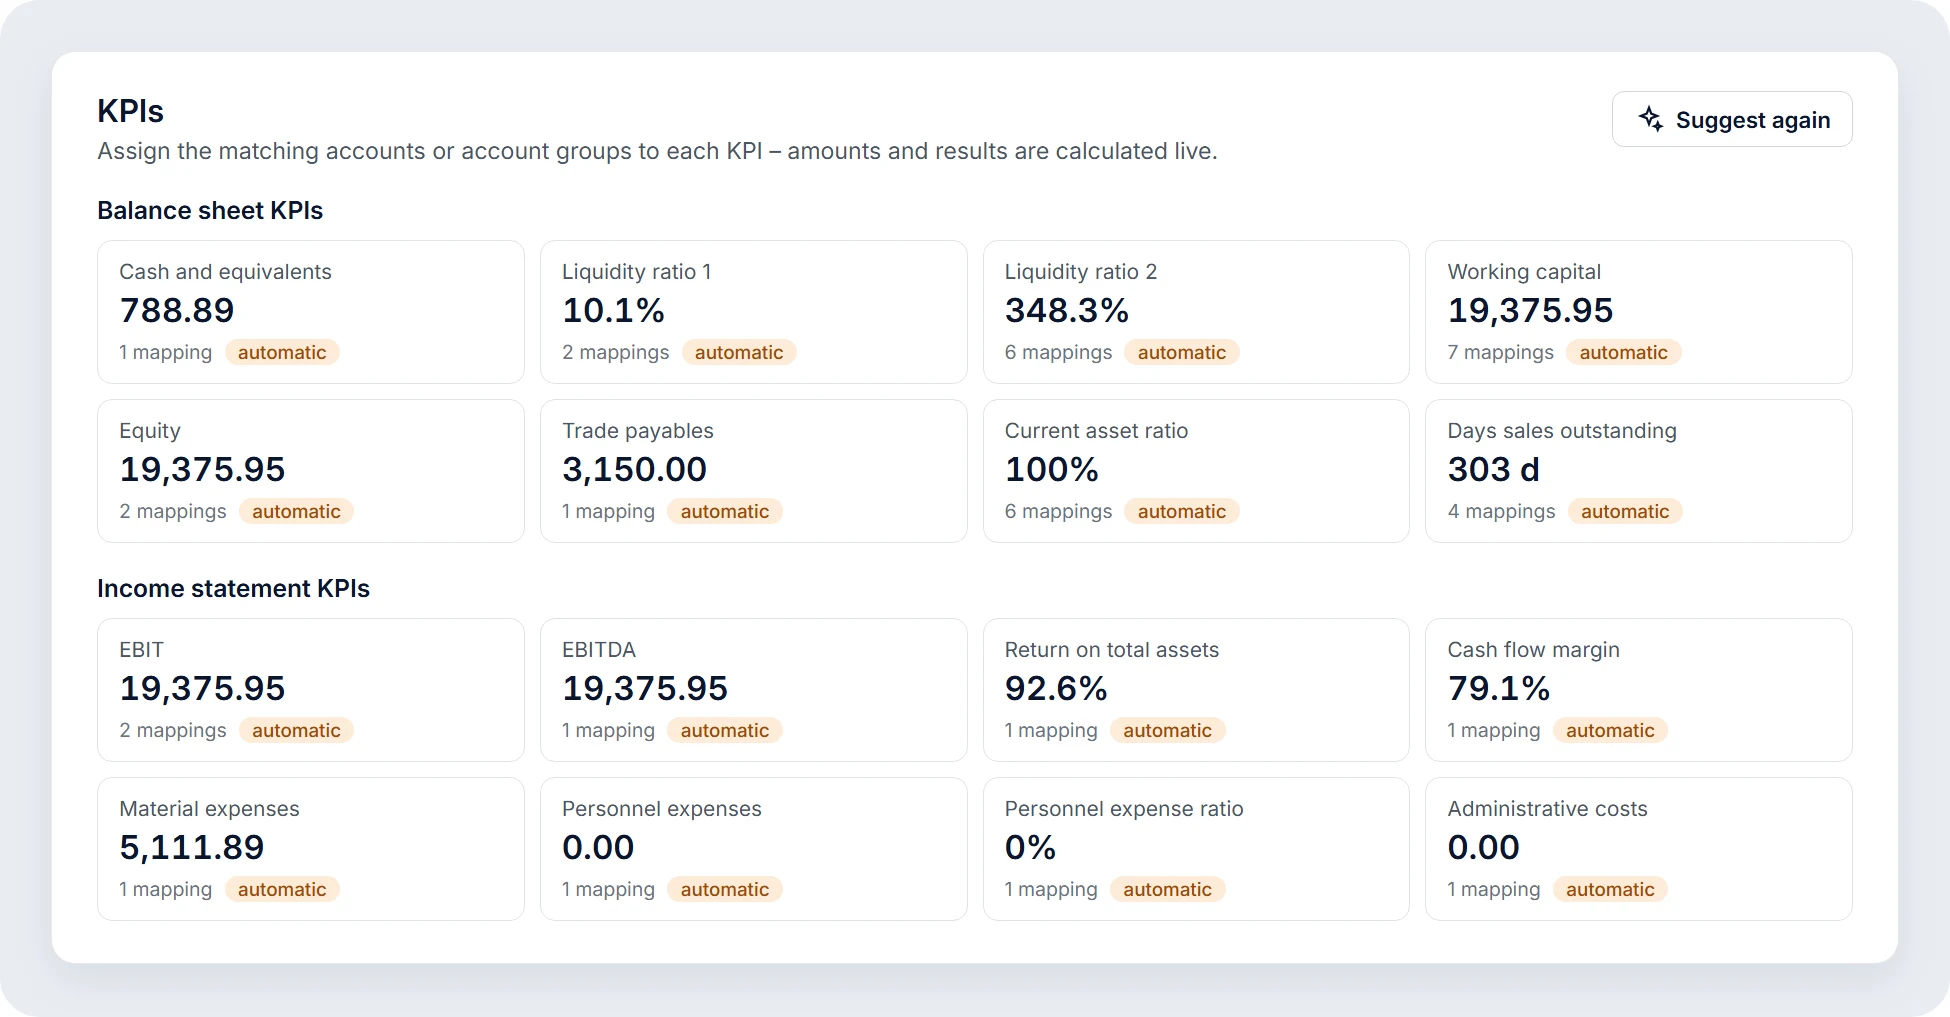
This is where things come full circle back to the Power BI days. The most common customisation requests are now part of the standard. Every new workspace starts with a report covering overview, sales, purchasing, income statement, balance sheet, working hours, projects and cash flow. On top of that comes a catalogue of business KPIs, from liquidity ratios and EBITDA margin to return on equity.
For the KPIs, someone has to define which accounts feed into which figure. That is exactly the work that used to cause customisation effort. Today the system suggests the mapping based on the account ranges of the Swiss SME chart of accounts and uses AI for ambiguous accounts. The customer only reviews and confirms.
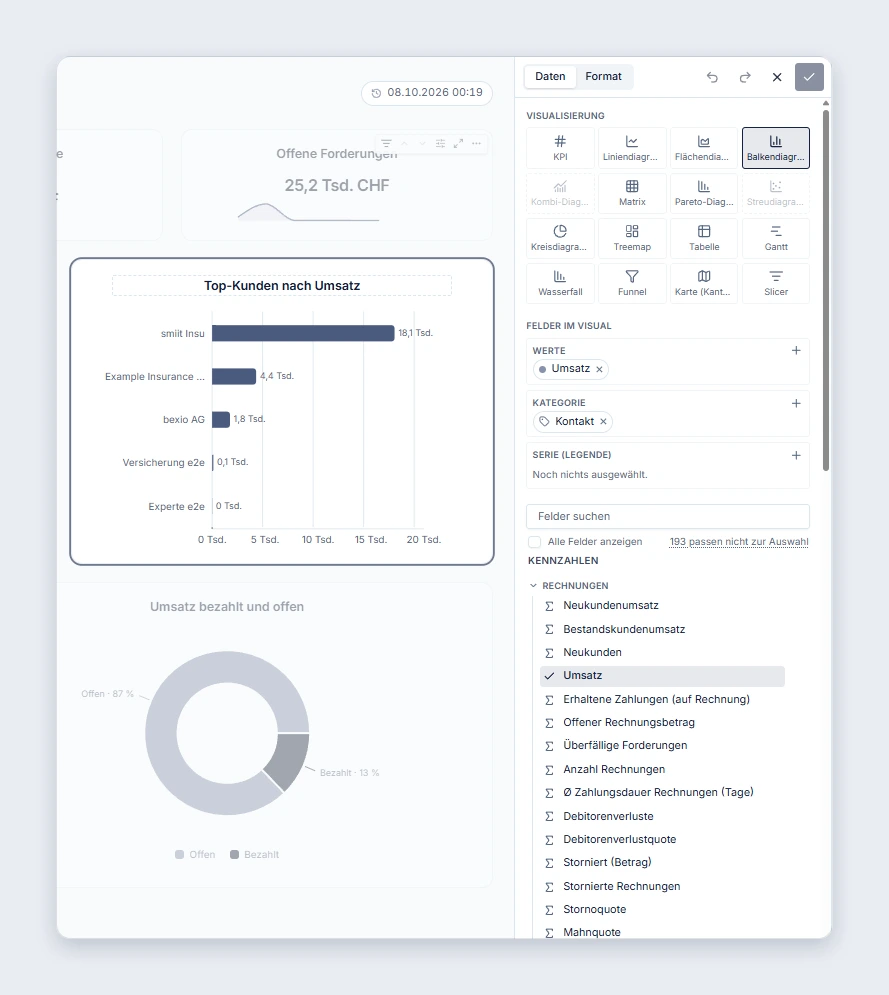
Beyond that, there are two AI features that we deliberately secured in different ways:
- Creating and editing reports. The AI works exclusively through the defined semantic model and changes report definitions, not code. Changes first land in a draft. Nothing is saved until the user approves.
- Exploring data freely. For questions no report anticipates (“Which customers have payment terms over 60 days and an open reminder, by canton?”), the AI may generate read-only queries. These run through a dedicated read-only database role, an allow-list of permitted tables and a read-only transaction — in addition to row-level security.
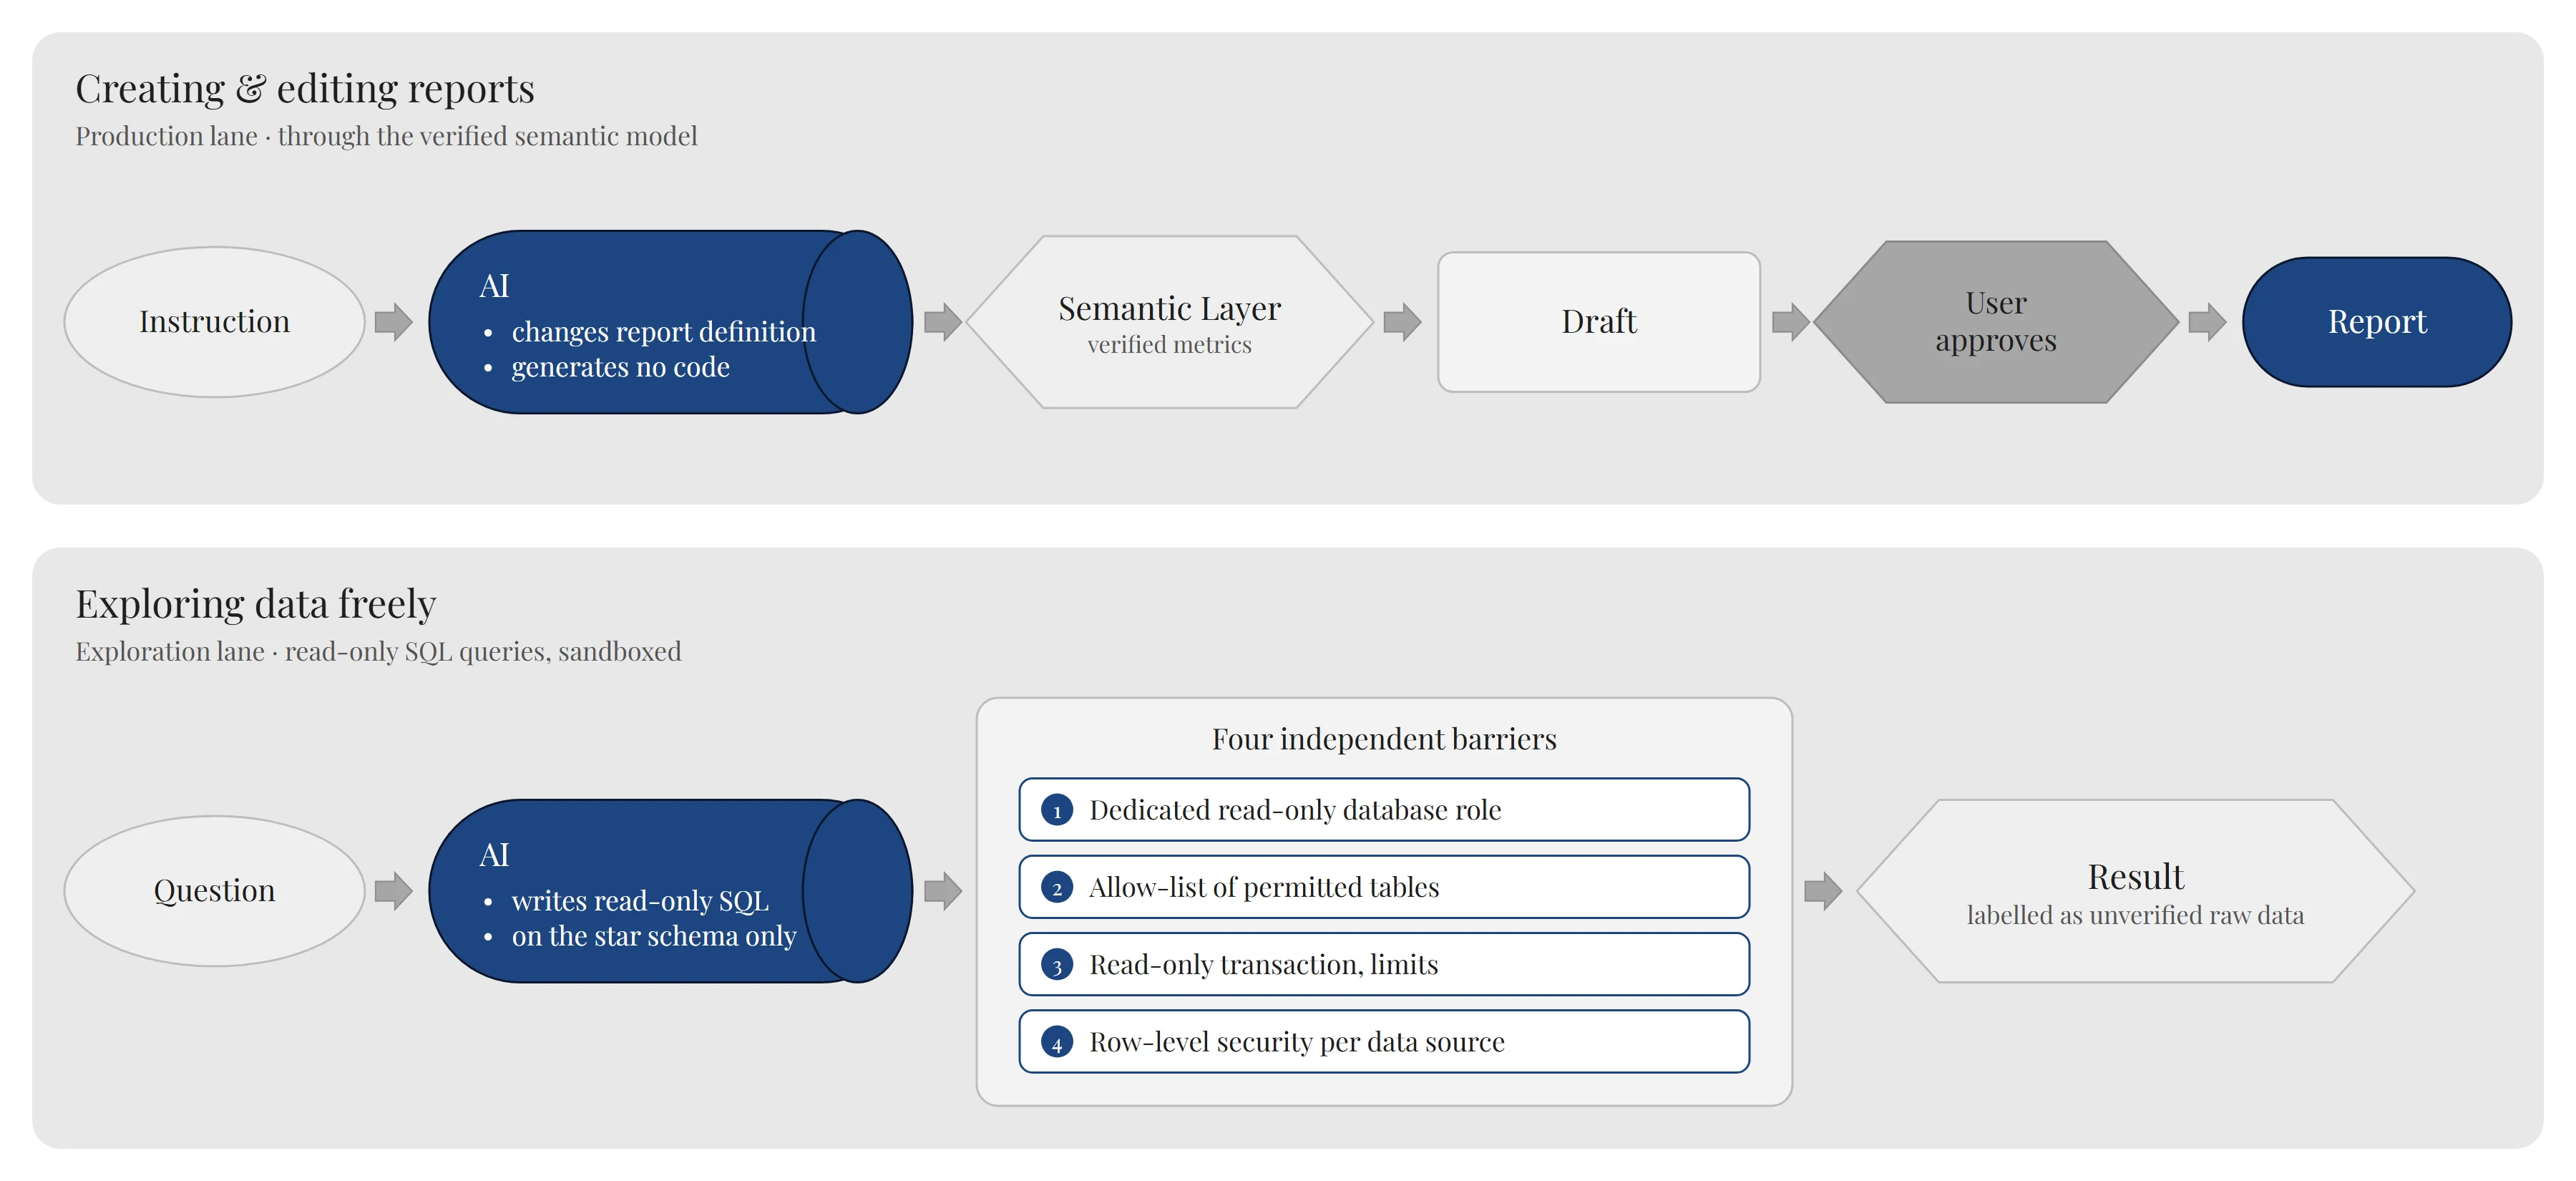
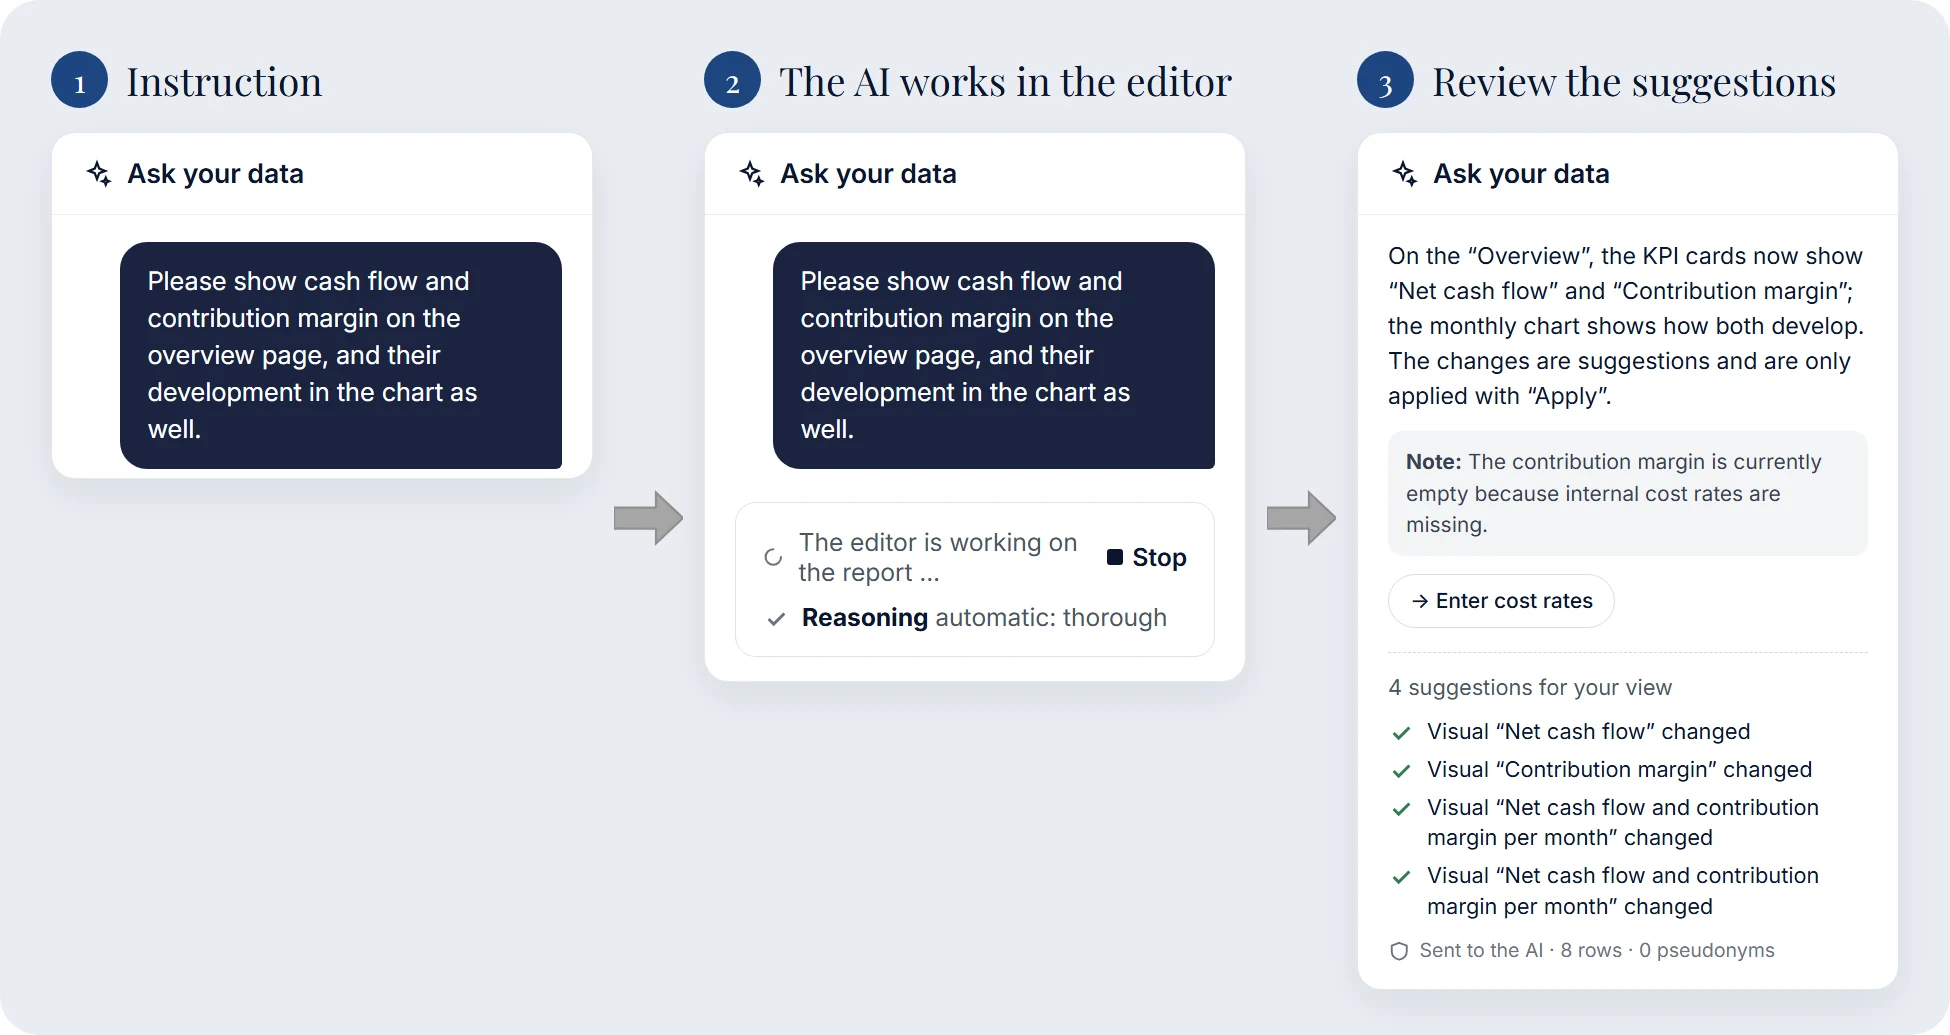
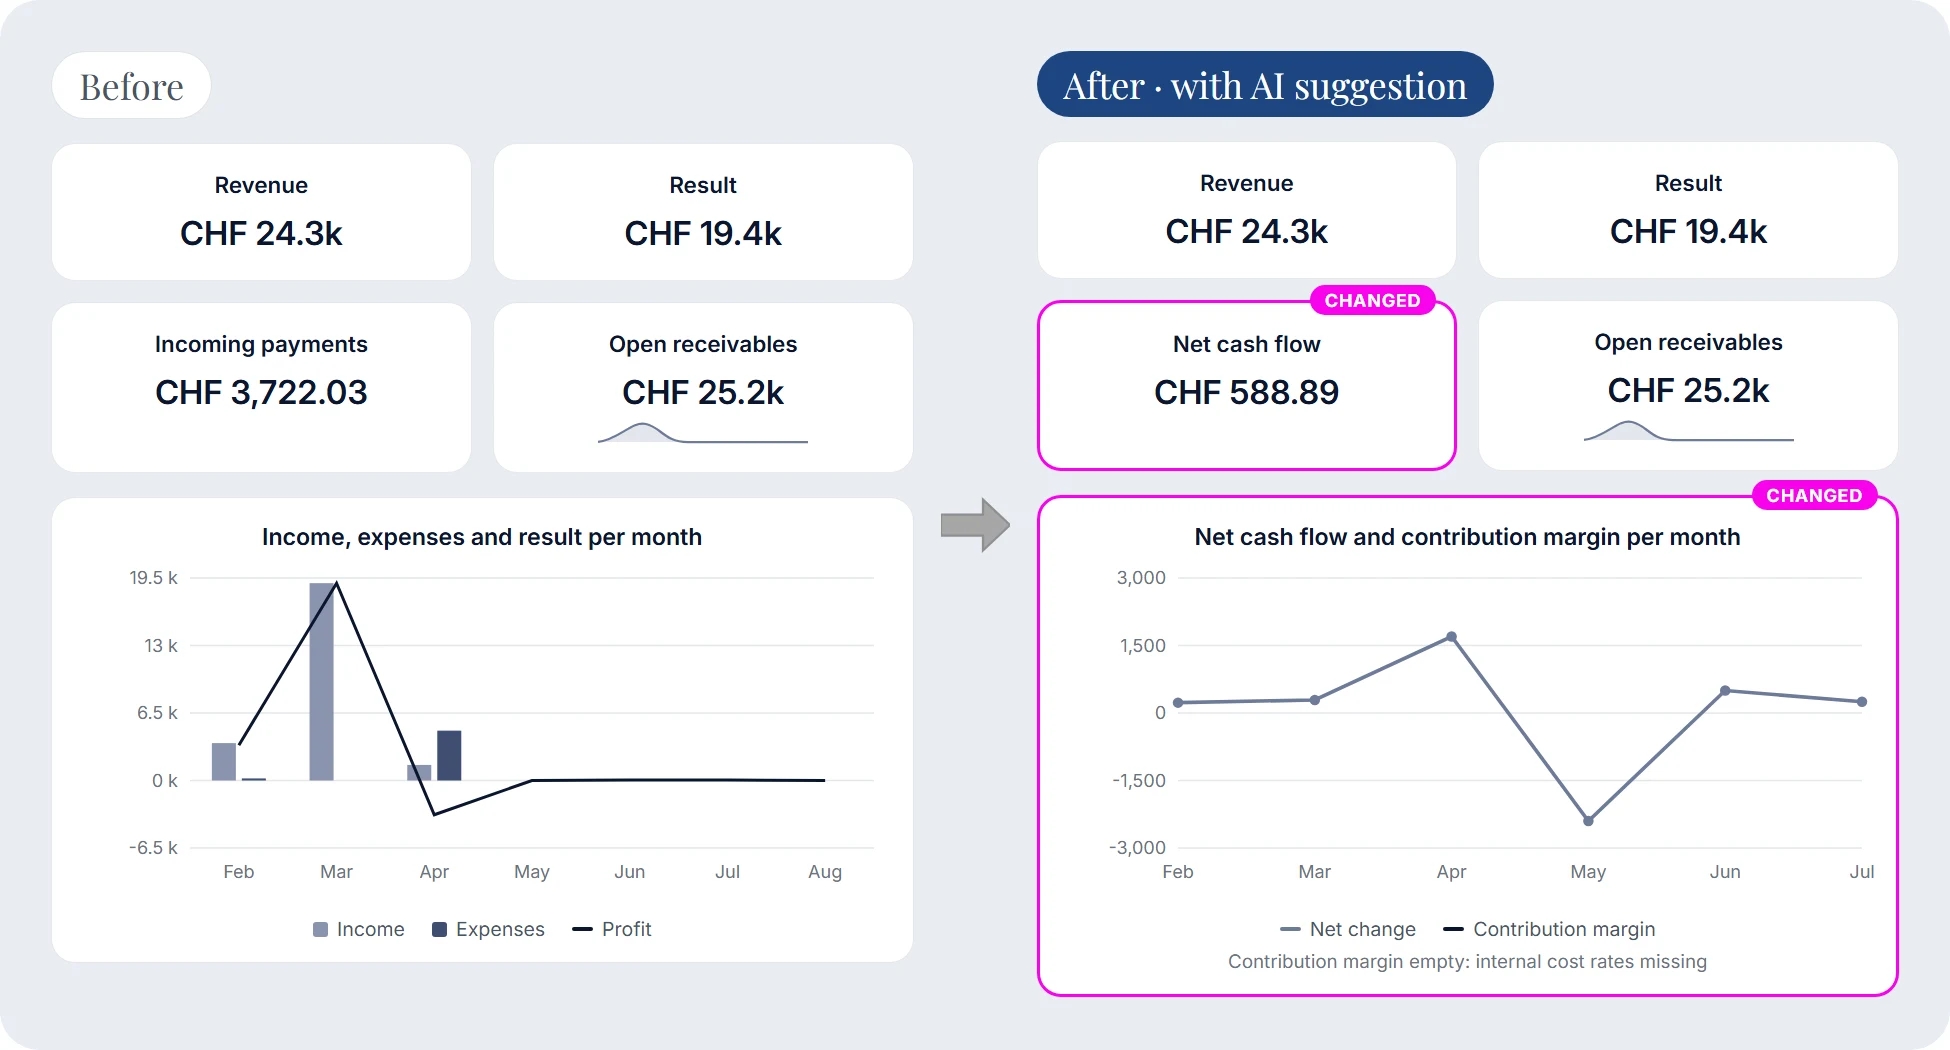
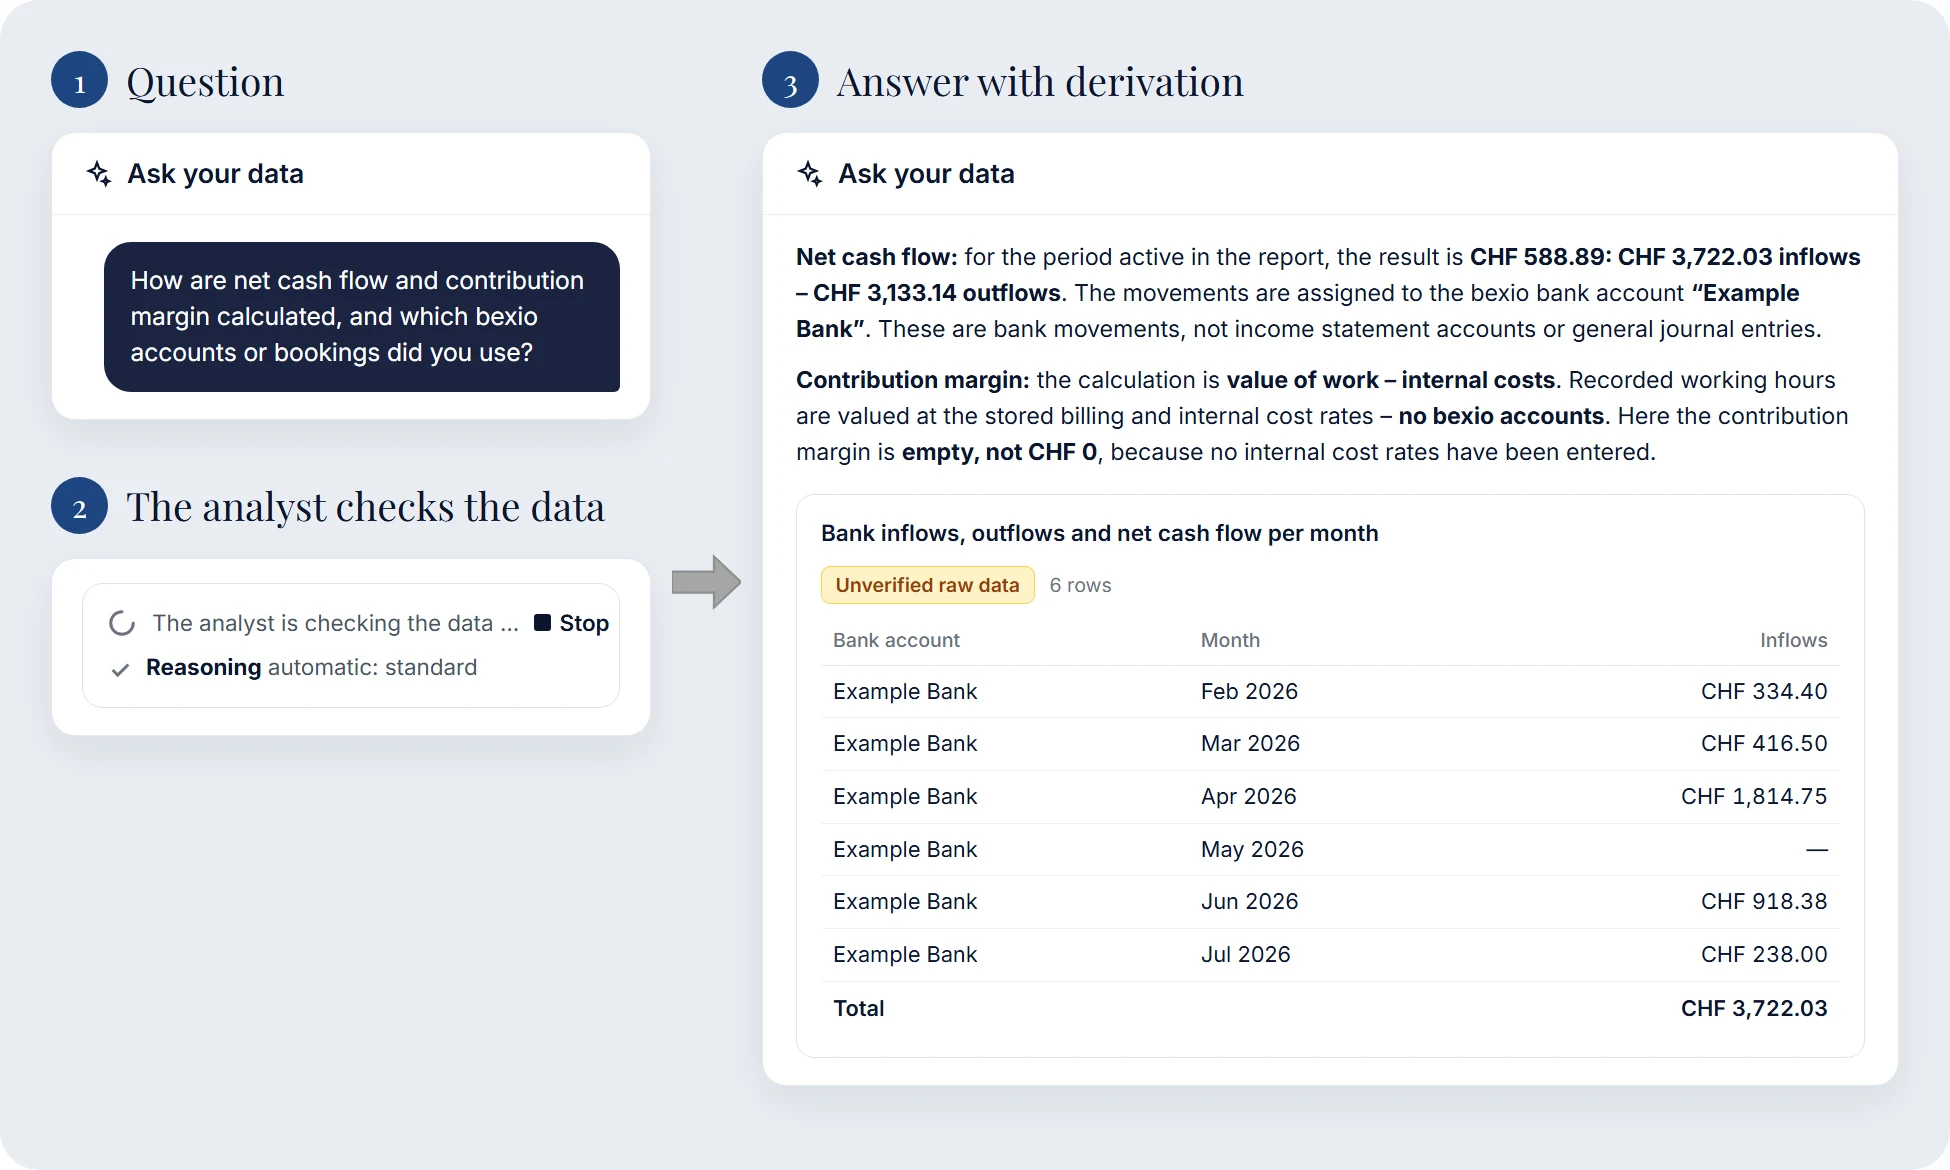
Why this separation? Research on natural-language database queries shows that enterprise-grade text-to-SQL is still not solved, despite large language models. Complex schemas and ambiguous terms lead to queries that look plausible but don't compute what was meant. In accounting, “revenue” isn't a column — it's a rule.[9]
And every point at which a language model generates queries is a potential target for prompt injection — the risk that tops the OWASP list for LLM applications. Whatever ends up in a report and gets shared therefore always goes through the verified model. Free exploration is allowed, but sandboxed.[10]
AI usage is budgeted per workspace and can be switched off.
Building with AI agents: an honest account
smiit Analytics was built in around three months. The first line of code was written in mid-June 2026; by mid-September, data integration, data model, reporting environment, AI features, user management and the operations console were in place.
- ~3 monthsfrom the first line of code to the finished platform
- 4 languagesGerman, English, French, Italian
- 22 architecture decisionsdocumented as architecture decision records
- ~1,800 testsautomated, including targeted isolation tests
Without AI coding agents, that would not have been possible in this time frame. But speed is only part of the story.
What the research says
Research doesn't paint a clear picture. In a controlled experiment, developers using GitHub Copilot completed a well-defined programming task 55.8% faster. A randomised study by METR with experienced open-source developers in large, mature codebases, by contrast, found that AI tools increased completion time by 19%. The participants themselves had expected a speed-up and perceived one in hindsight, too. The 2025 DORA report sums it up: AI acts as an amplifier. Strong teams get better, existing problems get bigger.[11][12][13]
Our experience fits this reading — and it explains why it worked for us.
What made the difference for us
- Architecture decisions stay with humans. We documented every fundamental decision — on tenant isolation, replacing dbt or securing the AI features — as an architecture decision record: context, options, decision, consequences. The AI worked out options and laid out consequences. We made the decisions. These documents were also the most important context for the agents, because an AI that knows the reasons behind a decision sticks to it far more reliably.[14]
- Tests are the guardrails. Especially for tenant isolation and KPI logic, we didn't just describe rules — we codified them as tests. A change that breaks a rule is noticed immediately, whether it comes from a human or an AI.
- Systematic review rounds. At regular intervals, we deliberately reviewed the entire codebase for security, performance and business correctness. Every finding got an ID, was fixed and was locked in with a test. Most of the “plausibly wrong” numbers described above were found in these rounds.
- Domain knowledge can't be delegated. No AI knows on its own that bexio books opening balances anew every year, or how fiduciaries want a balance sheet structured. Four years of bexio projects were the real foundation that made the speed usable in the first place.
Where we had to be careful
High speed also builds up technical debt quickly. Cunningham, who coined the term, wrote back in 1992 that a little debt speeds development, as long as it is paid back promptly. With AI agents, this applies all the more. Code is produced faster than you can read it. Solutions look complete at first glance, even when an edge case is missing. And documentation goes stale unless you actively maintain it. We started early to plan clean-up as a fixed part of every phase — for example consolidating database migrations, or reducing the semantic model from 29 to 9 central views.[15]
Our verdict on this point: AI agents didn't do our thinking for us, but they did most of the typing. If you know exactly what you want to build and consistently safeguard quality, you can deliver in weeks what used to take months.
What we learned
- 1The business model is part of the architectureOur first product didn't fail because of the technology, but because its operating model didn't allow a fair pricing model.
- 2Customisation has to scaleA standard product in which every customisation means development effort is a project business with a different label.
- 3Tenant isolation belongs in the databaseApplication code is the first line of defence, but not the last.
- 4Better to refuse than to miscalculateIn financial analysis, an error message is better than a plausible but wrong number.
- 5Standards are recommendations, not obligationsdbt is an excellent tool — it just didn't fit our core requirement.
- 6AI needs guardrails, in the product and in developmentIn both cases: clear boundaries, traceable decisions, tests.
- 7Domain knowledge is the real competitive advantageCode can be written quickly today. Knowing which code is the right code can't be accelerated.
Conclusion and outlook
smiit Analytics is the result of a detour that paid off. The Power BI version showed us what bexio customers really need — and, at the same time, how not to sell it to them. The new platform takes both lessons on board: it covers typical needs in the standard and enables individual analyses without any development effort.
smiit Analytics will soon be available through the bexio Marketplace, as a subscription per connected bexio company and user. We look forward to developing the platform further together with our first customers. And, to be honest, we're a little proud of what has come together over the past few months.